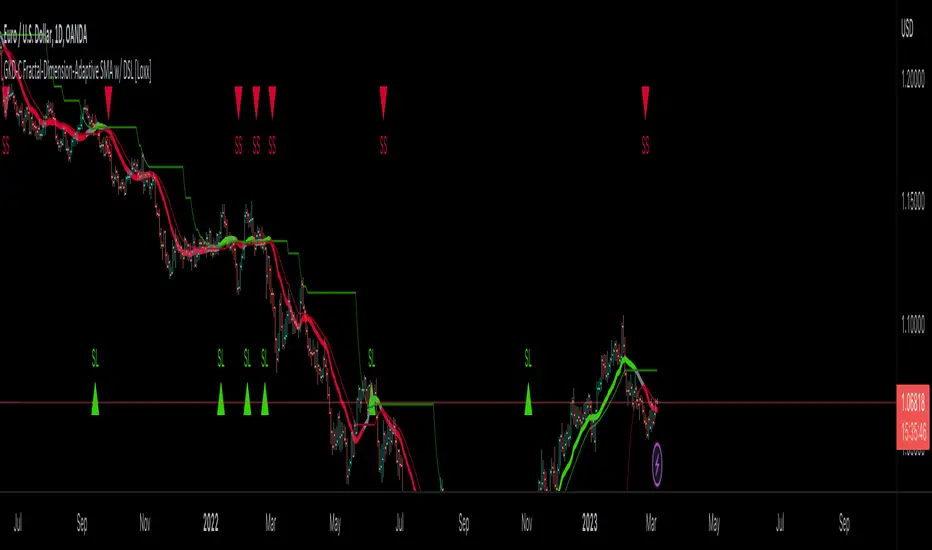
GKD-C Fractal-Dimension-Adaptive SMA w/ DSL [Loxx]Giga Kaleidoscope GKD-C Fractal-Dimension-Adaptive SMA w/ DSL is a Confirmation module included in Loxx's "Giga Kaleidoscope Modularized Trading System".
█ Giga Kaleidoscope Modularized Trading System
What is Loxx's "Giga Kaleidoscope Modularized Trading System"?
The Giga Kaleidoscope Modularized Trading System is a trading system built on the philosophy of the NNFX (No Nonsense Forex) algorithmic trading.
What is the NNFX algorithmic trading strategy?
The NNFX (No-Nonsense Forex) trading system is a comprehensive approach to Forex trading that is designed to simplify the process and remove the confusion and complexity that often surrounds trading. The system was developed by a Forex trader who goes by the pseudonym "VP" and has gained a significant following in the Forex community.
The NNFX trading system is based on a set of rules and guidelines that help traders make objective and informed decisions. These rules cover all aspects of trading, including market analysis, trade entry, stop loss placement, and trade management.
Here are the main components of the NNFX trading system:
1. Trading Philosophy: The NNFX trading system is based on the idea that successful trading requires a comprehensive understanding of the market, objective analysis, and strict risk management. The system aims to remove subjective elements from trading and focuses on objective rules and guidelines.
2. Technical Analysis: The NNFX trading system relies heavily on technical analysis and uses a range of indicators to identify high-probability trading opportunities. The system uses a combination of trend-following and mean-reverting strategies to identify trades.
3. Market Structure: The NNFX trading system emphasizes the importance of understanding the market structure, including price action, support and resistance levels, and market cycles. The system uses a range of tools to identify the market structure, including trend lines, channels, and moving averages.
4. Trade Entry: The NNFX trading system has strict rules for trade entry. The system uses a combination of technical indicators to identify high-probability trades, and traders must meet specific criteria to enter a trade.
5. Stop Loss Placement: The NNFX trading system places a significant emphasis on risk management and requires traders to place a stop loss order on every trade. The system uses a combination of technical analysis and market structure to determine the appropriate stop loss level.
6. Trade Management: The NNFX trading system has specific rules for managing open trades. The system aims to minimize risk and maximize profit by using a combination of trailing stops, take profit levels, and position sizing.
Overall, the NNFX trading system is designed to be a straightforward and easy-to-follow approach to Forex trading that can be applied by traders of all skill levels.
Core components of an NNFX algorithmic trading strategy
The NNFX algorithm is built on the principles of trend, momentum, and volatility. There are six core components in the NNFX trading algorithm:
1. Volatility - price volatility; e.g., Average True Range, True Range Double, Close-to-Close, etc.
2. Baseline - a moving average to identify price trend
3. Confirmation 1 - a technical indicator used to identify trends
4. Confirmation 2 - a technical indicator used to identify trends
5. Continuation - a technical indicator used to identify trends
6. Volatility/Volume - a technical indicator used to identify volatility/volume breakouts/breakdown
7. Exit - a technical indicator used to determine when a trend is exhausted
What is Volatility in the NNFX trading system?
In the NNFX (No Nonsense Forex) trading system, ATR (Average True Range) is typically used to measure the volatility of an asset. It is used as a part of the system to help determine the appropriate stop loss and take profit levels for a trade. ATR is calculated by taking the average of the true range values over a specified period.
True range is calculated as the maximum of the following values:
-Current high minus the current low
-Absolute value of the current high minus the previous close
-Absolute value of the current low minus the previous close
ATR is a dynamic indicator that changes with changes in volatility. As volatility increases, the value of ATR increases, and as volatility decreases, the value of ATR decreases. By using ATR in NNFX system, traders can adjust their stop loss and take profit levels according to the volatility of the asset being traded. This helps to ensure that the trade is given enough room to move, while also minimizing potential losses.
Other types of volatility include True Range Double (TRD), Close-to-Close, and Garman-Klass
What is a Baseline indicator?
The baseline is essentially a moving average, and is used to determine the overall direction of the market.
The baseline in the NNFX system is used to filter out trades that are not in line with the long-term trend of the market. The baseline is plotted on the chart along with other indicators, such as the Moving Average (MA), the Relative Strength Index (RSI), and the Average True Range (ATR).
Trades are only taken when the price is in the same direction as the baseline. For example, if the baseline is sloping upwards, only long trades are taken, and if the baseline is sloping downwards, only short trades are taken. This approach helps to ensure that trades are in line with the overall trend of the market, and reduces the risk of entering trades that are likely to fail.
By using a baseline in the NNFX system, traders can have a clear reference point for determining the overall trend of the market, and can make more informed trading decisions. The baseline helps to filter out noise and false signals, and ensures that trades are taken in the direction of the long-term trend.
What is a Confirmation indicator?
Confirmation indicators are technical indicators that are used to confirm the signals generated by primary indicators. Primary indicators are the core indicators used in the NNFX system, such as the Average True Range (ATR), the Moving Average (MA), and the Relative Strength Index (RSI).
The purpose of the confirmation indicators is to reduce false signals and improve the accuracy of the trading system. They are designed to confirm the signals generated by the primary indicators by providing additional information about the strength and direction of the trend.
Some examples of confirmation indicators that may be used in the NNFX system include the Bollinger Bands, the MACD (Moving Average Convergence Divergence), and the Stochastic Oscillator. These indicators can provide information about the volatility, momentum, and trend strength of the market, and can be used to confirm the signals generated by the primary indicators.
In the NNFX system, confirmation indicators are used in combination with primary indicators and other filters to create a trading system that is robust and reliable. By using multiple indicators to confirm trading signals, the system aims to reduce the risk of false signals and improve the overall profitability of the trades.
What is a Continuation indicator?
In the NNFX (No Nonsense Forex) trading system, a continuation indicator is a technical indicator that is used to confirm a current trend and predict that the trend is likely to continue in the same direction. A continuation indicator is typically used in conjunction with other indicators in the system, such as a baseline indicator, to provide a comprehensive trading strategy.
What is a Volatility/Volume indicator?
Volume indicators, such as the On Balance Volume (OBV), the Chaikin Money Flow (CMF), or the Volume Price Trend (VPT), are used to measure the amount of buying and selling activity in a market. They are based on the trading volume of the market, and can provide information about the strength of the trend. In the NNFX system, volume indicators are used to confirm trading signals generated by the Moving Average and the Relative Strength Index. Volatility indicators include Average Direction Index, Waddah Attar, and Volatility Ratio. In the NNFX trading system, volatility is a proxy for volume and vice versa.
By using volume indicators as confirmation tools, the NNFX trading system aims to reduce the risk of false signals and improve the overall profitability of trades. These indicators can provide additional information about the market that is not captured by the primary indicators, and can help traders to make more informed trading decisions. In addition, volume indicators can be used to identify potential changes in market trends and to confirm the strength of price movements.
What is an Exit indicator?
The exit indicator is used in conjunction with other indicators in the system, such as the Moving Average (MA), the Relative Strength Index (RSI), and the Average True Range (ATR), to provide a comprehensive trading strategy.
The exit indicator in the NNFX system can be any technical indicator that is deemed effective at identifying optimal exit points. Examples of exit indicators that are commonly used include the Parabolic SAR, the Average Directional Index (ADX), and the Chandelier Exit.
The purpose of the exit indicator is to identify when a trend is likely to reverse or when the market conditions have changed, signaling the need to exit a trade. By using an exit indicator, traders can manage their risk and prevent significant losses.
In the NNFX system, the exit indicator is used in conjunction with a stop loss and a take profit order to maximize profits and minimize losses. The stop loss order is used to limit the amount of loss that can be incurred if the trade goes against the trader, while the take profit order is used to lock in profits when the trade is moving in the trader's favor.
Overall, the use of an exit indicator in the NNFX trading system is an important component of a comprehensive trading strategy. It allows traders to manage their risk effectively and improve the profitability of their trades by exiting at the right time.
How does Loxx's GKD (Giga Kaleidoscope Modularized Trading System) implement the NNFX algorithm outlined above?
Loxx's GKD v1.0 system has five types of modules (indicators/strategies). These modules are:
1. GKD-BT - Backtesting module (Volatility, Number 1 in the NNFX algorithm)
2. GKD-B - Baseline module (Baseline and Volatility/Volume, Numbers 1 and 2 in the NNFX algorithm)
3. GKD-C - Confirmation 1/2 and Continuation module (Confirmation 1/2 and Continuation, Numbers 3, 4, and 5 in the NNFX algorithm)
4. GKD-V - Volatility/Volume module (Confirmation 1/2, Number 6 in the NNFX algorithm)
5. GKD-E - Exit module (Exit, Number 7 in the NNFX algorithm)
(additional module types will added in future releases)
Each module interacts with every module by passing data between modules. Data is passed between each module as described below:
GKD-B => GKD-V => GKD-C(1) => GKD-C(2) => GKD-C(Continuation) => GKD-E => GKD-BT
That is, the Baseline indicator passes its data to Volatility/Volume. The Volatility/Volume indicator passes its values to the Confirmation 1 indicator. The Confirmation 1 indicator passes its values to the Confirmation 2 indicator. The Confirmation 2 indicator passes its values to the Continuation indicator. The Continuation indicator passes its values to the Exit indicator, and finally, the Exit indicator passes its values to the Backtest strategy.
This chaining of indicators requires that each module conform to Loxx's GKD protocol, therefore allowing for the testing of every possible combination of technical indicators that make up the six components of the NNFX algorithm.
What does the application of the GKD trading system look like?
Example trading system:
Backtest: Strategy with 1-3 take profits, trailing stop loss, multiple types of PnL volatility, and 2 backtesting styles
Baseline: Hull Moving Average
Volatility/Volume: Jurik DMX
Confirmation 1: GKD-V Fractal-Dimension-Adaptive SMA w/ DSL as shown on the chart above
Confirmation 2: Williams Percent Range
Continuation: Fisher Transform
Exit: Rex Oscillator
Each GKD indicator is denoted with a module identifier of either: GKD-BT, GKD-B, GKD-C, GKD-V, or GKD-E. This allows traders to understand to which module each indicator belongs and where each indicator fits into the GKD protocol chain.
Giga Kaleidoscope Modularized Trading System Signals (based on the NNFX algorithm)
Standard Entry
1. GKD-C Confirmation 1 Signal
2. GKD-B Baseline agrees
3. Price is within a range of 0.2x Volatility and 1.0x Volatility of the Goldie Locks Mean
4. GKD-C Confirmation 2 agrees
5. GKD-V Volatility/Volume agrees
Baseline Entry
1. GKD-B Baseline signal
2. GKD-C Confirmation 1 agrees
3. Price is within a range of 0.2x Volatility and 1.0x Volatility of the Goldie Locks Mean
4. GKD-C Confirmation 2 agrees
5. GKD-V Volatility/Volume agrees
6. GKD-C Confirmation 1 signal was less than 7 candles prior
Continuation Entry
1. Standard Entry, Baseline Entry, or Pullback; entry triggered previously
2. GKD-B Baseline hasn't crossed since entry signal trigger
3. GKD-C Confirmation Continuation Indicator signals
4. GKD-C Confirmation 1 agrees
5. GKD-B Baseline agrees
6. GKD-C Confirmation 2 agrees
1-Candle Rule Standard Entry
1. GKD-C Confirmation 1 signal
2. GKD-B Baseline agrees
3. Price is within a range of 0.2x Volatility and 1.0x Volatility of the Goldie Locks Mean
Next Candle:
1. Price retraced (Long: close < close or Short: close > close )
2. GKD-B Baseline agrees
3. GKD-C Confirmation 1 agrees
4. GKD-C Confirmation 2 agrees
5. GKD-V Volatility/Volume agrees
1-Candle Rule Baseline Entry
1. GKD-B Baseline signal
2. GKD-C Confirmation 1 agrees
3. Price is within a range of 0.2x Volatility and 1.0x Volatility of the Goldie Locks Mean
4. GKD-C Confirmation 1 signal was less than 7 candles prior
Next Candle:
1. Price retraced (Long: close < close or Short: close > close )
2. GKD-B Baseline agrees
3. GKD-C Confirmation 1 agrees
4. GKD-C Confirmation 2 agrees
5. GKD-V Volatility/Volume Agrees
PullBack Entry
1. GKD-B Baseline signal
2. GKD-C Confirmation 1 agrees
3. Price is beyond 1.0x Volatility of Baseline
Next Candle:
1. Price is within a range of 0.2x Volatility and 1.0x Volatility of the Goldie Locks Mean
3. GKD-C Confirmation 1 agrees
4. GKD-C Confirmation 2 agrees
5. GKD-V Volatility/Volume Agrees
█ GKD-V Fractal-Dimension-Adaptive SMA w/ DSL
Fractal-Dimension-Adaptive SMA (FDASMA) w/ DSL is a fractal-dimension-index-adaptive SMA . The SMA is accelerated during a trend and slowed down during a sideways market, so as to avoid false signals. This indicator uses the fractal dimension to compute an ingest period length into the SMA to output the FDASMA.
What is the Fractal Dimension Index?
The goal of the fractal dimension index is to determine whether the market is trending or in a trading range. It does not measure the direction of the trend. A value less than 1.5 indicates that the price series is persistent or that the market is trending. Lower values of the FDI indicate a stronger trend. A value greater than 1.5 indicates that the market is in a trading range and is acting in a more random fashion.
What are DSL Discontinued Signal Line?
A lot of indicators are using signal lines in order to determine the trend (or some desired state of the indicator) easier. The idea of the signal line is easy : comparing the value to it's smoothed (slightly lagging) state, the idea of current momentum/state is made.
Discontinued signal line is inheriting that simple signal line idea and it is extending it : instead of having one signal line, more lines depending on the current value of the indicator.
"Signal" line is calculated the following way :
When a certain level is crossed into the desired direction, the EMA of that value is calculated for the desired signal line
When that level is crossed into the opposite direction, the previous "signal" line value is simply "inherited" and it becomes a kind of a level
This way it becomes a combination of signal lines and levels that are trying to combine both the good from both methods.
In simple terms, DSL uses the concept of a signal line and betters it by inheriting the previous signal line's value & makes it a level.
Requirements
Inputs
Confirmation 1 and Solo Confirmation: GKD-V Volatility / Volume indicator
Confirmation 2: GKD-C Confirmation indicator
Outputs
Confirmation 2 and Solo Confirmation Complex: GKD-E Exit indicator
Confirmation 1: GKD-C Confirmation indicator
Continuation: GKD-E Exit indicator
Solo Confirmation Simple: GKD-BT Backtest strategy
Additional features will be added in future releases.
在脚本中搜索"take profit"
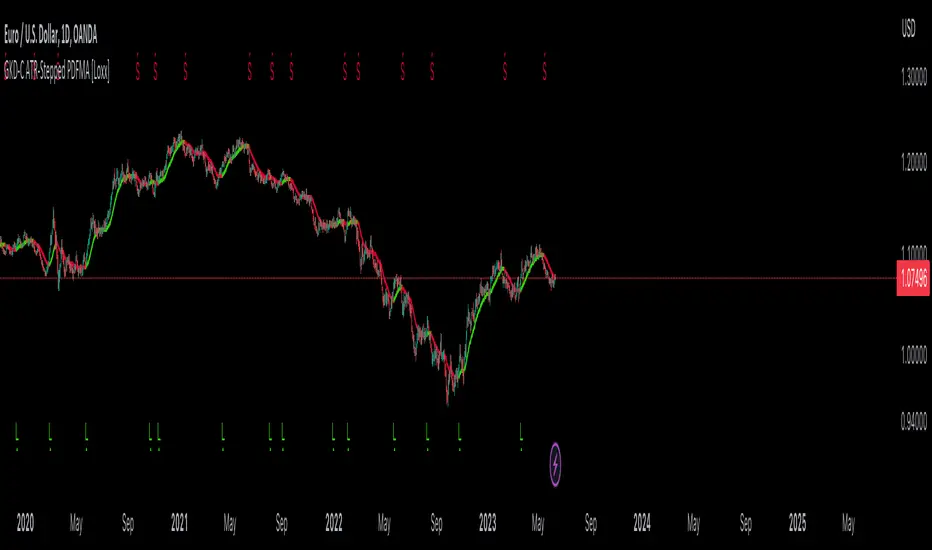
GKD-C ATR-Stepped PDFMA [Loxx]Giga Kaleidoscope GKD-C ATR-Stepped PDFMA is a Confirmation module included in Loxx's "Giga Kaleidoscope Modularized Trading System".
█ Giga Kaleidoscope Modularized Trading System
What is Loxx's "Giga Kaleidoscope Modularized Trading System"?
The Giga Kaleidoscope Modularized Trading System is a trading system built on the philosophy of the NNFX (No Nonsense Forex) algorithmic trading.
What is the NNFX algorithmic trading strategy?
The NNFX (No-Nonsense Forex) trading system is a comprehensive approach to Forex trading that is designed to simplify the process and remove the confusion and complexity that often surrounds trading. The system was developed by a Forex trader who goes by the pseudonym "VP" and has gained a significant following in the Forex community.
The NNFX trading system is based on a set of rules and guidelines that help traders make objective and informed decisions. These rules cover all aspects of trading, including market analysis, trade entry, stop loss placement, and trade management.
Here are the main components of the NNFX trading system:
1. Trading Philosophy: The NNFX trading system is based on the idea that successful trading requires a comprehensive understanding of the market, objective analysis, and strict risk management. The system aims to remove subjective elements from trading and focuses on objective rules and guidelines.
2. Technical Analysis: The NNFX trading system relies heavily on technical analysis and uses a range of indicators to identify high-probability trading opportunities. The system uses a combination of trend-following and mean-reverting strategies to identify trades.
3. Market Structure: The NNFX trading system emphasizes the importance of understanding the market structure, including price action, support and resistance levels, and market cycles. The system uses a range of tools to identify the market structure, including trend lines, channels, and moving averages.
4. Trade Entry: The NNFX trading system has strict rules for trade entry. The system uses a combination of technical indicators to identify high-probability trades, and traders must meet specific criteria to enter a trade.
5. Stop Loss Placement: The NNFX trading system places a significant emphasis on risk management and requires traders to place a stop loss order on every trade. The system uses a combination of technical analysis and market structure to determine the appropriate stop loss level.
6. Trade Management: The NNFX trading system has specific rules for managing open trades. The system aims to minimize risk and maximize profit by using a combination of trailing stops, take profit levels, and position sizing.
Overall, the NNFX trading system is designed to be a straightforward and easy-to-follow approach to Forex trading that can be applied by traders of all skill levels.
Core components of an NNFX algorithmic trading strategy
The NNFX algorithm is built on the principles of trend, momentum, and volatility. There are six core components in the NNFX trading algorithm:
1. Volatility - price volatility; e.g., Average True Range, True Range Double, Close-to-Close, etc.
2. Baseline - a moving average to identify price trend
3. Confirmation 1 - a technical indicator used to identify trends
4. Confirmation 2 - a technical indicator used to identify trends
5. Continuation - a technical indicator used to identify trends
6. Volatility/Volume - a technical indicator used to identify volatility/volume breakouts/breakdown
7. Exit - a technical indicator used to determine when a trend is exhausted
What is Volatility in the NNFX trading system?
In the NNFX (No Nonsense Forex) trading system, ATR (Average True Range) is typically used to measure the volatility of an asset. It is used as a part of the system to help determine the appropriate stop loss and take profit levels for a trade. ATR is calculated by taking the average of the true range values over a specified period.
True range is calculated as the maximum of the following values:
-Current high minus the current low
-Absolute value of the current high minus the previous close
-Absolute value of the current low minus the previous close
ATR is a dynamic indicator that changes with changes in volatility. As volatility increases, the value of ATR increases, and as volatility decreases, the value of ATR decreases. By using ATR in NNFX system, traders can adjust their stop loss and take profit levels according to the volatility of the asset being traded. This helps to ensure that the trade is given enough room to move, while also minimizing potential losses.
Other types of volatility include True Range Double (TRD), Close-to-Close, and Garman-Klass
What is a Baseline indicator?
The baseline is essentially a moving average, and is used to determine the overall direction of the market.
The baseline in the NNFX system is used to filter out trades that are not in line with the long-term trend of the market. The baseline is plotted on the chart along with other indicators, such as the Moving Average (MA), the Relative Strength Index (RSI), and the Average True Range (ATR).
Trades are only taken when the price is in the same direction as the baseline. For example, if the baseline is sloping upwards, only long trades are taken, and if the baseline is sloping downwards, only short trades are taken. This approach helps to ensure that trades are in line with the overall trend of the market, and reduces the risk of entering trades that are likely to fail.
By using a baseline in the NNFX system, traders can have a clear reference point for determining the overall trend of the market, and can make more informed trading decisions. The baseline helps to filter out noise and false signals, and ensures that trades are taken in the direction of the long-term trend.
What is a Confirmation indicator?
Confirmation indicators are technical indicators that are used to confirm the signals generated by primary indicators. Primary indicators are the core indicators used in the NNFX system, such as the Average True Range (ATR), the Moving Average (MA), and the Relative Strength Index (RSI).
The purpose of the confirmation indicators is to reduce false signals and improve the accuracy of the trading system. They are designed to confirm the signals generated by the primary indicators by providing additional information about the strength and direction of the trend.
Some examples of confirmation indicators that may be used in the NNFX system include the Bollinger Bands, the MACD (Moving Average Convergence Divergence), and the Stochastic Oscillator. These indicators can provide information about the volatility, momentum, and trend strength of the market, and can be used to confirm the signals generated by the primary indicators.
In the NNFX system, confirmation indicators are used in combination with primary indicators and other filters to create a trading system that is robust and reliable. By using multiple indicators to confirm trading signals, the system aims to reduce the risk of false signals and improve the overall profitability of the trades.
What is a Continuation indicator?
In the NNFX (No Nonsense Forex) trading system, a continuation indicator is a technical indicator that is used to confirm a current trend and predict that the trend is likely to continue in the same direction. A continuation indicator is typically used in conjunction with other indicators in the system, such as a baseline indicator, to provide a comprehensive trading strategy.
What is a Volatility/Volume indicator?
Volume indicators, such as the On Balance Volume (OBV), the Chaikin Money Flow (CMF), or the Volume Price Trend (VPT), are used to measure the amount of buying and selling activity in a market. They are based on the trading volume of the market, and can provide information about the strength of the trend. In the NNFX system, volume indicators are used to confirm trading signals generated by the Moving Average and the Relative Strength Index. Volatility indicators include Average Direction Index, Waddah Attar, and Volatility Ratio. In the NNFX trading system, volatility is a proxy for volume and vice versa.
By using volume indicators as confirmation tools, the NNFX trading system aims to reduce the risk of false signals and improve the overall profitability of trades. These indicators can provide additional information about the market that is not captured by the primary indicators, and can help traders to make more informed trading decisions. In addition, volume indicators can be used to identify potential changes in market trends and to confirm the strength of price movements.
What is an Exit indicator?
The exit indicator is used in conjunction with other indicators in the system, such as the Moving Average (MA), the Relative Strength Index (RSI), and the Average True Range (ATR), to provide a comprehensive trading strategy.
The exit indicator in the NNFX system can be any technical indicator that is deemed effective at identifying optimal exit points. Examples of exit indicators that are commonly used include the Parabolic SAR, the Average Directional Index (ADX), and the Chandelier Exit.
The purpose of the exit indicator is to identify when a trend is likely to reverse or when the market conditions have changed, signaling the need to exit a trade. By using an exit indicator, traders can manage their risk and prevent significant losses.
In the NNFX system, the exit indicator is used in conjunction with a stop loss and a take profit order to maximize profits and minimize losses. The stop loss order is used to limit the amount of loss that can be incurred if the trade goes against the trader, while the take profit order is used to lock in profits when the trade is moving in the trader's favor.
Overall, the use of an exit indicator in the NNFX trading system is an important component of a comprehensive trading strategy. It allows traders to manage their risk effectively and improve the profitability of their trades by exiting at the right time.
How does Loxx's GKD (Giga Kaleidoscope Modularized Trading System) implement the NNFX algorithm outlined above?
Loxx's GKD v1.0 system has five types of modules (indicators/strategies). These modules are:
1. GKD-BT - Backtesting module (Volatility, Number 1 in the NNFX algorithm)
2. GKD-B - Baseline module (Baseline and Volatility/Volume, Numbers 1 and 2 in the NNFX algorithm)
3. GKD-C - Confirmation 1/2 and Continuation module (Confirmation 1/2 and Continuation, Numbers 3, 4, and 5 in the NNFX algorithm)
4. GKD-V - Volatility/Volume module (Confirmation 1/2, Number 6 in the NNFX algorithm)
5. GKD-E - Exit module (Exit, Number 7 in the NNFX algorithm)
(additional module types will added in future releases)
Each module interacts with every module by passing data between modules. Data is passed between each module as described below:
GKD-B => GKD-V => GKD-C(1) => GKD-C(2) => GKD-C(Continuation) => GKD-E => GKD-BT
That is, the Baseline indicator passes its data to Volatility/Volume. The Volatility/Volume indicator passes its values to the Confirmation 1 indicator. The Confirmation 1 indicator passes its values to the Confirmation 2 indicator. The Confirmation 2 indicator passes its values to the Continuation indicator. The Continuation indicator passes its values to the Exit indicator, and finally, the Exit indicator passes its values to the Backtest strategy.
This chaining of indicators requires that each module conform to Loxx's GKD protocol, therefore allowing for the testing of every possible combination of technical indicators that make up the six components of the NNFX algorithm.
What does the application of the GKD trading system look like?
Example trading system:
Backtest: Strategy with 1-3 take profits, trailing stop loss, multiple types of PnL volatility, and 2 backtesting styles
Baseline: Hull Moving Average
Volatility/Volume: Jurik DMX as shown on the chart
Confirmation 1: GKD-V ATR-Stepped PDFMA as shown on the chart above
Confirmation 2: Williams Percent Range
Continuation: Fisher Transform
Exit: Rex Oscillator
Each GKD indicator is denoted with a module identifier of either: GKD-BT, GKD-B, GKD-C, GKD-V, or GKD-E. This allows traders to understand to which module each indicator belongs and where each indicator fits into the GKD protocol chain.
Giga Kaleidoscope Modularized Trading System Signals (based on the NNFX algorithm)
Standard Entry
1. GKD-C Confirmation 1 Signal
2. GKD-B Baseline agrees
3. Price is within a range of 0.2x Volatility and 1.0x Volatility of the Goldie Locks Mean
4. GKD-C Confirmation 2 agrees
5. GKD-V Volatility/Volume agrees
Baseline Entry
1. GKD-B Baseline signal
2. GKD-C Confirmation 1 agrees
3. Price is within a range of 0.2x Volatility and 1.0x Volatility of the Goldie Locks Mean
4. GKD-C Confirmation 2 agrees
5. GKD-V Volatility/Volume agrees
6. GKD-C Confirmation 1 signal was less than 7 candles prior
Continuation Entry
1. Standard Entry, Baseline Entry, or Pullback; entry triggered previously
2. GKD-B Baseline hasn't crossed since entry signal trigger
3. GKD-C Confirmation Continuation Indicator signals
4. GKD-C Confirmation 1 agrees
5. GKD-B Baseline agrees
6. GKD-C Confirmation 2 agrees
1-Candle Rule Standard Entry
1. GKD-C Confirmation 1 signal
2. GKD-B Baseline agrees
3. Price is within a range of 0.2x Volatility and 1.0x Volatility of the Goldie Locks Mean
Next Candle:
1. Price retraced (Long: close < close or Short: close > close )
2. GKD-B Baseline agrees
3. GKD-C Confirmation 1 agrees
4. GKD-C Confirmation 2 agrees
5. GKD-V Volatility/Volume agrees
1-Candle Rule Baseline Entry
1. GKD-B Baseline signal
2. GKD-C Confirmation 1 agrees
3. Price is within a range of 0.2x Volatility and 1.0x Volatility of the Goldie Locks Mean
4. GKD-C Confirmation 1 signal was less than 7 candles prior
Next Candle:
1. Price retraced (Long: close < close or Short: close > close )
2. GKD-B Baseline agrees
3. GKD-C Confirmation 1 agrees
4. GKD-C Confirmation 2 agrees
5. GKD-V Volatility/Volume Agrees
PullBack Entry
1. GKD-B Baseline signal
2. GKD-C Confirmation 1 agrees
3. Price is beyond 1.0x Volatility of Baseline
Next Candle:
1. Price is within a range of 0.2x Volatility and 1.0x Volatility of the Goldie Locks Mean
3. GKD-C Confirmation 1 agrees
4. GKD-C Confirmation 2 agrees
5. GKD-V Volatility/Volume Agrees
█ GKD-V ATR-Stepped PDFMA
ATR-Stepped PDF MA is and ATR-stepped moving average that uses a probability density function moving average.
What is Probability Density Function?
Probability Density Function (PDF) is a statistical function used to describe the likelihood of a continuous random variable taking on a particular value or range of values. In other words, it describes the probability distribution of a random variable over a continuous range of values.
The PDF is defined as the derivative of the cumulative distribution function (CDF) of a continuous random variable. The CDF of a continuous random variable is the probability that the random variable takes on a value less than or equal to a given value. The PDF is a non-negative function that integrates to 1 over the entire range of the random variable.
The PDF is used to calculate the probability of the random variable taking on a value within a specific range. This is done by integrating the PDF over that range. The height of the PDF at a particular value of the random variable indicates the relative likelihood of that value occurring.
The PDF is an essential tool in many areas of statistics, including hypothesis testing, confidence interval estimation, and Bayesian inference.
Probability density function based MA is a sort of weighted moving average that uses probability density function to calculate the weights.
Requirements
Inputs
Confirmation 1 and Solo Confirmation: GKD-V Volatility / Volume indicator
Confirmation 2: GKD-C Confirmation indicator
Outputs
Confirmation 2 and Solo Confirmation Complex: GKD-E Exit indicator
Confirmation 1: GKD-C Confirmation indicator
Continuation: GKD-E Exit indicator
Solo Confirmation Simple: GKD-BT Backtest strategy
Additional features will be added in future releases.
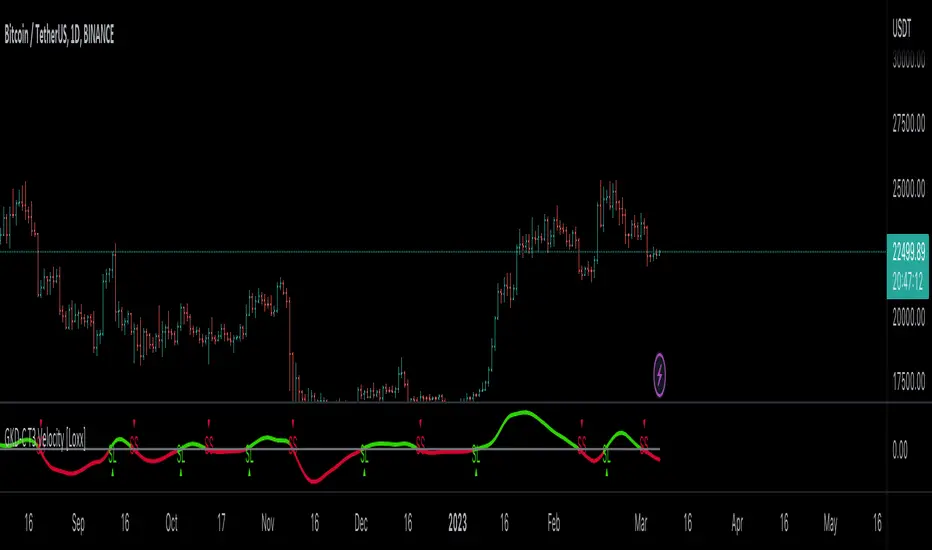
GKD-C T3 Velocity [Loxx]Giga Kaleidoscope GKD-C T3 Velocity is a Confirmation module included in Loxx's "Giga Kaleidoscope Modularized Trading System".
█ Giga Kaleidoscope Modularized Trading System
What is Loxx's "Giga Kaleidoscope Modularized Trading System"?
The Giga Kaleidoscope Modularized Trading System is a trading system built on the philosophy of the NNFX (No Nonsense Forex) algorithmic trading.
What is the NNFX algorithmic trading strategy?
The NNFX (No-Nonsense Forex) trading system is a comprehensive approach to Forex trading that is designed to simplify the process and remove the confusion and complexity that often surrounds trading. The system was developed by a Forex trader who goes by the pseudonym "VP" and has gained a significant following in the Forex community.
The NNFX trading system is based on a set of rules and guidelines that help traders make objective and informed decisions. These rules cover all aspects of trading, including market analysis, trade entry, stop loss placement, and trade management.
Here are the main components of the NNFX trading system:
1. Trading Philosophy: The NNFX trading system is based on the idea that successful trading requires a comprehensive understanding of the market, objective analysis, and strict risk management. The system aims to remove subjective elements from trading and focuses on objective rules and guidelines.
2. Technical Analysis: The NNFX trading system relies heavily on technical analysis and uses a range of indicators to identify high-probability trading opportunities. The system uses a combination of trend-following and mean-reverting strategies to identify trades.
3. Market Structure: The NNFX trading system emphasizes the importance of understanding the market structure, including price action, support and resistance levels, and market cycles. The system uses a range of tools to identify the market structure, including trend lines, channels, and moving averages.
4. Trade Entry: The NNFX trading system has strict rules for trade entry. The system uses a combination of technical indicators to identify high-probability trades, and traders must meet specific criteria to enter a trade.
5. Stop Loss Placement: The NNFX trading system places a significant emphasis on risk management and requires traders to place a stop loss order on every trade. The system uses a combination of technical analysis and market structure to determine the appropriate stop loss level.
6. Trade Management: The NNFX trading system has specific rules for managing open trades. The system aims to minimize risk and maximize profit by using a combination of trailing stops, take profit levels, and position sizing.
Overall, the NNFX trading system is designed to be a straightforward and easy-to-follow approach to Forex trading that can be applied by traders of all skill levels.
Core components of an NNFX algorithmic trading strategy
The NNFX algorithm is built on the principles of trend, momentum, and volatility. There are six core components in the NNFX trading algorithm:
1. Volatility - price volatility; e.g., Average True Range, True Range Double, Close-to-Close, etc.
2. Baseline - a moving average to identify price trend
3. Confirmation 1 - a technical indicator used to identify trends
4. Confirmation 2 - a technical indicator used to identify trends
5. Continuation - a technical indicator used to identify trends
6. Volatility/Volume - a technical indicator used to identify volatility/volume breakouts/breakdown
7. Exit - a technical indicator used to determine when a trend is exhausted
What is Volatility in the NNFX trading system?
In the NNFX (No Nonsense Forex) trading system, ATR (Average True Range) is typically used to measure the volatility of an asset. It is used as a part of the system to help determine the appropriate stop loss and take profit levels for a trade. ATR is calculated by taking the average of the true range values over a specified period.
True range is calculated as the maximum of the following values:
-Current high minus the current low
-Absolute value of the current high minus the previous close
-Absolute value of the current low minus the previous close
ATR is a dynamic indicator that changes with changes in volatility. As volatility increases, the value of ATR increases, and as volatility decreases, the value of ATR decreases. By using ATR in NNFX system, traders can adjust their stop loss and take profit levels according to the volatility of the asset being traded. This helps to ensure that the trade is given enough room to move, while also minimizing potential losses.
Other types of volatility include True Range Double (TRD), Close-to-Close, and Garman-Klass
What is a Baseline indicator?
The baseline is essentially a moving average, and is used to determine the overall direction of the market.
The baseline in the NNFX system is used to filter out trades that are not in line with the long-term trend of the market. The baseline is plotted on the chart along with other indicators, such as the Moving Average (MA), the Relative Strength Index (RSI), and the Average True Range (ATR).
Trades are only taken when the price is in the same direction as the baseline. For example, if the baseline is sloping upwards, only long trades are taken, and if the baseline is sloping downwards, only short trades are taken. This approach helps to ensure that trades are in line with the overall trend of the market, and reduces the risk of entering trades that are likely to fail.
By using a baseline in the NNFX system, traders can have a clear reference point for determining the overall trend of the market, and can make more informed trading decisions. The baseline helps to filter out noise and false signals, and ensures that trades are taken in the direction of the long-term trend.
What is a Confirmation indicator?
Confirmation indicators are technical indicators that are used to confirm the signals generated by primary indicators. Primary indicators are the core indicators used in the NNFX system, such as the Average True Range (ATR), the Moving Average (MA), and the Relative Strength Index (RSI).
The purpose of the confirmation indicators is to reduce false signals and improve the accuracy of the trading system. They are designed to confirm the signals generated by the primary indicators by providing additional information about the strength and direction of the trend.
Some examples of confirmation indicators that may be used in the NNFX system include the Bollinger Bands, the MACD (Moving Average Convergence Divergence), and the Stochastic Oscillator. These indicators can provide information about the volatility, momentum, and trend strength of the market, and can be used to confirm the signals generated by the primary indicators.
In the NNFX system, confirmation indicators are used in combination with primary indicators and other filters to create a trading system that is robust and reliable. By using multiple indicators to confirm trading signals, the system aims to reduce the risk of false signals and improve the overall profitability of the trades.
What is a Continuation indicator?
In the NNFX (No Nonsense Forex) trading system, a continuation indicator is a technical indicator that is used to confirm a current trend and predict that the trend is likely to continue in the same direction. A continuation indicator is typically used in conjunction with other indicators in the system, such as a baseline indicator, to provide a comprehensive trading strategy.
What is a Volatility/Volume indicator?
Volume indicators, such as the On Balance Volume (OBV), the Chaikin Money Flow (CMF), or the Volume Price Trend (VPT), are used to measure the amount of buying and selling activity in a market. They are based on the trading volume of the market, and can provide information about the strength of the trend. In the NNFX system, volume indicators are used to confirm trading signals generated by the Moving Average and the Relative Strength Index. Volatility indicators include Average Direction Index, Waddah Attar, and Volatility Ratio. In the NNFX trading system, volatility is a proxy for volume and vice versa.
By using volume indicators as confirmation tools, the NNFX trading system aims to reduce the risk of false signals and improve the overall profitability of trades. These indicators can provide additional information about the market that is not captured by the primary indicators, and can help traders to make more informed trading decisions. In addition, volume indicators can be used to identify potential changes in market trends and to confirm the strength of price movements.
What is an Exit indicator?
The exit indicator is used in conjunction with other indicators in the system, such as the Moving Average (MA), the Relative Strength Index (RSI), and the Average True Range (ATR), to provide a comprehensive trading strategy.
The exit indicator in the NNFX system can be any technical indicator that is deemed effective at identifying optimal exit points. Examples of exit indicators that are commonly used include the Parabolic SAR, the Average Directional Index (ADX), and the Chandelier Exit.
The purpose of the exit indicator is to identify when a trend is likely to reverse or when the market conditions have changed, signaling the need to exit a trade. By using an exit indicator, traders can manage their risk and prevent significant losses.
In the NNFX system, the exit indicator is used in conjunction with a stop loss and a take profit order to maximize profits and minimize losses. The stop loss order is used to limit the amount of loss that can be incurred if the trade goes against the trader, while the take profit order is used to lock in profits when the trade is moving in the trader's favor.
Overall, the use of an exit indicator in the NNFX trading system is an important component of a comprehensive trading strategy. It allows traders to manage their risk effectively and improve the profitability of their trades by exiting at the right time.
How does Loxx's GKD (Giga Kaleidoscope Modularized Trading System) implement the NNFX algorithm outlined above?
Loxx's GKD v1.0 system has five types of modules (indicators/strategies). These modules are:
1. GKD-BT - Backtesting module (Volatility, Number 1 in the NNFX algorithm)
2. GKD-B - Baseline module (Baseline and Volatility/Volume, Numbers 1 and 2 in the NNFX algorithm)
3. GKD-C - Confirmation 1/2 and Continuation module (Confirmation 1/2 and Continuation, Numbers 3, 4, and 5 in the NNFX algorithm)
4. GKD-V - Volatility/Volume module (Confirmation 1/2, Number 6 in the NNFX algorithm)
5. GKD-E - Exit module (Exit, Number 7 in the NNFX algorithm)
(additional module types will added in future releases)
Each module interacts with every module by passing data between modules. Data is passed between each module as described below:
GKD-B => GKD-V => GKD-C(1) => GKD-C(2) => GKD-C(Continuation) => GKD-E => GKD-BT
That is, the Baseline indicator passes its data to Volatility/Volume. The Volatility/Volume indicator passes its values to the Confirmation 1 indicator. The Confirmation 1 indicator passes its values to the Confirmation 2 indicator. The Confirmation 2 indicator passes its values to the Continuation indicator. The Continuation indicator passes its values to the Exit indicator, and finally, the Exit indicator passes its values to the Backtest strategy.
This chaining of indicators requires that each module conform to Loxx's GKD protocol, therefore allowing for the testing of every possible combination of technical indicators that make up the six components of the NNFX algorithm.
What does the application of the GKD trading system look like?
Example trading system:
Backtest: Strategy with 1-3 take profits, trailing stop loss, multiple types of PnL volatility, and 2 backtesting styles
Baseline: Hull Moving Average
Volatility/Volume: Volatility Ratio
Confirmation 1: GKD-V T3 Velocity as shown on the chart above
Confirmation 2: Williams Percent Range
Continuation: Fisher Transform
Exit: Rex Oscillator
Each GKD indicator is denoted with a module identifier of either: GKD-BT, GKD-B, GKD-C, GKD-V, or GKD-E. This allows traders to understand to which module each indicator belongs and where each indicator fits into the GKD protocol chain.
Giga Kaleidoscope Modularized Trading System Signals (based on the NNFX algorithm)
Standard Entry
1. GKD-C Confirmation 1 Signal
2. GKD-B Baseline agrees
3. Price is within a range of 0.2x Volatility and 1.0x Volatility of the Goldie Locks Mean
4. GKD-C Confirmation 2 agrees
5. GKD-V Volatility/Volume agrees
Baseline Entry
1. GKD-B Baseline signal
2. GKD-C Confirmation 1 agrees
3. Price is within a range of 0.2x Volatility and 1.0x Volatility of the Goldie Locks Mean
4. GKD-C Confirmation 2 agrees
5. GKD-V Volatility/Volume agrees
6. GKD-C Confirmation 1 signal was less than 7 candles prior
Continuation Entry
1. Standard Entry, Baseline Entry, or Pullback; entry triggered previously
2. GKD-B Baseline hasn't crossed since entry signal trigger
3. GKD-C Confirmation Continuation Indicator signals
4. GKD-C Confirmation 1 agrees
5. GKD-B Baseline agrees
6. GKD-C Confirmation 2 agrees
1-Candle Rule Standard Entry
1. GKD-C Confirmation 1 signal
2. GKD-B Baseline agrees
3. Price is within a range of 0.2x Volatility and 1.0x Volatility of the Goldie Locks Mean
Next Candle:
1. Price retraced (Long: close < close or Short: close > close )
2. GKD-B Baseline agrees
3. GKD-C Confirmation 1 agrees
4. GKD-C Confirmation 2 agrees
5. GKD-V Volatility/Volume agrees
1-Candle Rule Baseline Entry
1. GKD-B Baseline signal
2. GKD-C Confirmation 1 agrees
3. Price is within a range of 0.2x Volatility and 1.0x Volatility of the Goldie Locks Mean
4. GKD-C Confirmation 1 signal was less than 7 candles prior
Next Candle:
1. Price retraced (Long: close < close or Short: close > close )
2. GKD-B Baseline agrees
3. GKD-C Confirmation 1 agrees
4. GKD-C Confirmation 2 agrees
5. GKD-V Volatility/Volume Agrees
PullBack Entry
1. GKD-B Baseline signal
2. GKD-C Confirmation 1 agrees
3. Price is beyond 1.0x Volatility of Baseline
Next Candle:
1. Price is within a range of 0.2x Volatility and 1.0x Volatility of the Goldie Locks Mean
3. GKD-C Confirmation 1 agrees
4. GKD-C Confirmation 2 agrees
5. GKD-V Volatility/Volume Agrees
█ GKD-V T3 Velocity
What is T3?
The T3 Moving Average (T3MA) is a technical analysis indicator that was developed by Tim Tillson. It is a trend-following indicator that aims to provide a smoother and more accurate representation of price trends than other moving average indicators.
The T3MA is a type of exponential moving average (EMA) that is calculated using a series of complex formulas. Unlike a simple or exponential moving average, which use fixed smoothing factors, the T3MA uses a variable smoothing factor that is based on the volatility of the underlying asset. This means that the T3MA is able to adapt to changing market conditions and provide more accurate signals.
The formula for calculating the T3MA is as follows:
T3 = a * EMA1 + (1 - a) * T3
Where:
-T3 is the current value of the T3MA
-EMA1 is the current value of the first EMA
-T3 is the previous value of the T3MA
-a is the smoothing factor, which is based on the volatility of the underlying asset and is calculated using the following formulas:
-c1 = -1 + exp(-sqrt(2) * pi / period)
-c2 = 2 * c1 * c1 + 2 * c1
-c3 = 1 - c1 - c2
-a = c1 * sqrt(period) * (close - T3 ) + c2 * T3 + c3 * EMA1
In simple terms, the T3MA is calculated by taking a weighted average of two different EMAs, with the weight given to each EMA depending on the volatility of the asset being analyzed. The T3MA is then smoothed using a second smoothing factor, which further reduces noise and improves the accuracy of the indicator.
The T3MA can be used in a variety of ways by traders and analysts. Some common applications include using the T3MA as a trend-following indicator, with buy signals generated when the price of an asset crosses above the T3MA and sell signals generated when the price crosses below. The T3MA can also be used in combination with other indicators and analytical techniques to confirm trading decisions and identify potential trend reversals.
Overall, the T3 Moving Average is a highly sophisticated and complex technical indicator that is designed to provide a more accurate and reliable representation of price trends. While it may be difficult for novice traders to understand and use effectively, experienced traders and analysts may find the T3MA to be a valuable tool in their trading toolbox.
What is Velocity?
Velocity can have different meanings depending on the context. Here are a few definitions:
In physics, velocity is a measure of the rate and direction of motion of an object. It is typically expressed in meters per second (m/s) or another unit of distance divided by time.
In finance and economics, velocity refers to the speed at which money circulates in an economy. It is usually measured as the ratio of gross domestic product (GDP) to the money supply.
In trading, velocity can refer to the speed and magnitude of price movements. It can be used as an indicator of momentum or trend strength.
What is T3 Velocity?
T3 Velocity is a better performing MACD that uses different hot (alpha) values for the slow and fast period inputs.
Requirements
Inputs
Confirmation 1 and Solo Confirmation: GKD-V Volatility / Volume indicator
Confirmation 2: GKD-C Confirmation indicator
Outputs
Confirmation 2 and Solo Confirmation Complex: GKD-E Exit indicator
Confirmation 1: GKD-C Confirmation indicator
Continuation: GKD-E Exit indicator
Solo Confirmation Simple: GKD-BT Backtest strategy
Additional features will be added in future releases.
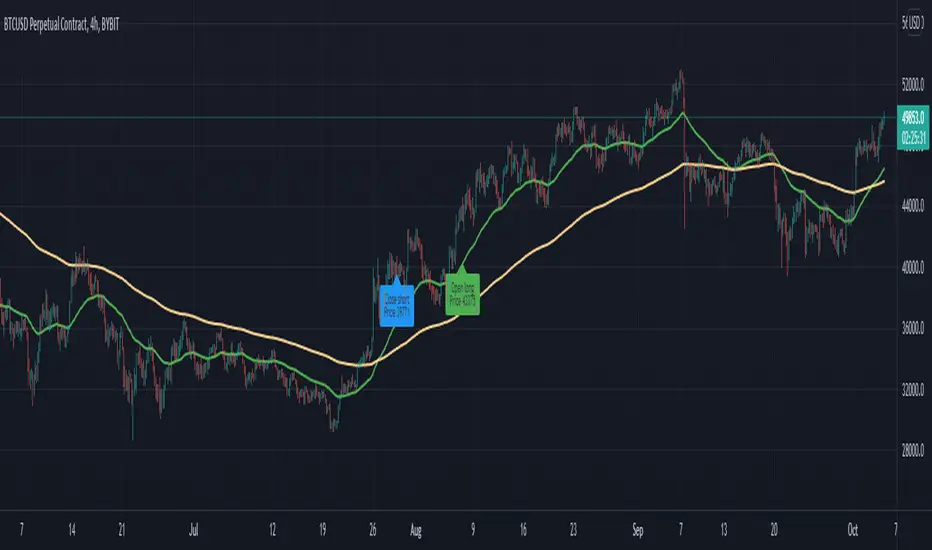
EMASAR Investor ModePLEASE READ THE FULL DESCRIPTION BEFORE BUYING OR USING THIS INDICATOR
THIS IS THE INVESTOR MODE ONLY VERSION OF THE EMASAR INDICATOR. IT INCLUDES THE ORIGINAL SIGNALS TELLING YOU WHEN TO BUY OR SELL. IT ONLY INCLUDES THE OCEAN TO INDICATE PULLBACKS AND NOT OTHER TRADING REGIONS ARE INCLUDED. IT SHOWS THE BUY/SELL SIGNALS AS WAS PUBLISHED IN THE ORIGINAL VERSION OF EMASAR
EMASAR (pronounced Emma-sar) is a strategy based on Exponential Moving Averages and the Parabolic SAR. This is a position trading approach that is derived from Tyler Jenks’ Consensio.
This strategy was developed with four objectives in mind: (1) managing risk (2) protecting from missing out on major moves (3) maximizing risk:reward (4) staying in a trending market and taking profit before it fully reverses.
EMASAR does a great job at accomplishing all of the above through the buy and sell signals that are generated. The data provided below is from the signals that occurred on Bitcoin ( Bitstamp ) from January 1, 2015 to present (November 11, 2019).
(1) Risk is tightly managed, relative to the winners, and losing positions will be exited before the market moves too far against.
The biggest losing trade on Bitcoin , for the time period outlined above, is -18.47%.
(2) Following the EMASAR buy and sell signals guarantees that one will not miss out on a major trend. As a result of the indicators used for this system it is mathematically impossible for a major trend to occur without providing a buy or sell signal. This system isn't meant to catch exact tops or bottoms but it will do a great job of capturing ~85% of a trend.
(3) On average the winning trades will be 5.55 times the losing trades. There will be stretches where the losers are bigger than the winners and this could last for many months, maybe even a year. However, over the long run the average reward is expected to be 5.55 times the average risk*.
*Past performance does not guarantee future results!
(4) This indicator was designed to capitalize on parabolic markets, specifically Bitcoin and alt coins. Crypto markets have a tendency to get moving so fast that many indicators become all but useless.
Entries can get signaled too late and exits will get signaled way too early. This is specifically true when using oscillators that are designed to identify overbought or oversold environments. EMASAR does a great job of keeping us in a position for the duration of a trend and this includes the major parabolic runs that Bitcoin has a tendency to go on.
When Bitcoin , or other alts, really get moving it can be very difficult to distinguish between a correction and a full reversal. We do not want to be exiting during a minor correction, instead this is a time when we want to be holding on or looking to buy the dip.
This is a very fragile balance. The market has a very strong tendency to make corrections looks like reversals and to make reversals look like corrections. Therefore it is very important to have a tool(s) that you trust to distinguish in between the two.
I believe that EMASAR is the best way to find that balance - if I knew of a better way then I would be using it instead!
Following these signals will help us to hold onto positions while the market is still trending in our favor when most think that it has moved too far / too fast, and it will also get us out before a market fully reverses.
Keep in mind that there will be times when we exit a market that is in danger of reversing, only to buy back higher later on. That is okay because it enables us to properly manage risk during times of uncertainty and buying back in at a higher price is more than worth the opportunity cost.
Risks
The biggest risks with trading EMASAR revolve around disobeying the signals. Risk management is built into this system with the exit signals that will occur, however it is up to the individual to execute those signals. Passing on an exit signal could lead to a big loss which would have a dramatic impact on the ROI . Most trading systems will have small and medium losses with small, medium and large wins. That is exactly how this works. The small - medium losses and wins will mostly be a wash and will account for roughly 80% of the trades. The large wins will happen about 20% of the time and will make up 80% - 90% of the profits.
Therefore the two biggest risks are passing on signals entirely, or exiting preemptively. Getting chopped in and out of a market can be quite frustrating. If you become overwhelmed with negative emotions then it could cause you to pass up on the next signal. That signal will often be the one that more than makes up for the small - medium losses that preceded.
On average EMASAR will provide one signal every 6 weeks when using the default settings on the 4h chart. Therefore missing one entry could turn an otherwise profitable year into a loser. If electing to trade a system, whether it is EMASAR or another, it is crucial to commit to taking every signal regardless of outside variables (namely your personal bias about market direction or frustration that follows a losing stretch).
Another major risk with this system is taking too much profit too soon. When getting into a trade that has the potential to be a big winner it can be challenging to continue holding through the swings. Anyone that has watched paper profits vanish will be inclined to start exiting after the market makes a big move in his or her favor. While this is better than watching profits completely evaporate, this mistake can be enough to turn a profitable system into one that loses to the market. If 80% - 90% of our profits come from 10% - 20% of our trades then it is vital we do not cut those positions off at the knees.
If taking too much profit too soon then you will consistently turn potential large winners into medium winners. This may lead to making money over the long run which will make it very difficult to realize that anything is wrong. However making money and beating the market are two very different things. Exiting early and making money is nearly as big of a risk as missing entries entirely.
If you have the discipline to execute signals in a timely manner after they are triggered and the emotional control to let the winners run despite the appearance of a vastly overbought / oversold market, then you should have what it takes to beat the market with EMASAR.
If you are not an experienced trader then it is very important to start out small. The only way to learn is to trade in a live environment and the only way to succeed is to risk much less than you can afford to lose. If you have $2,000 to trade with then start with a maximum position size of $20 - $50 and don’t be shy about scaling that down even further. Focus on ROI instead of actual dollars made. If you can return 100% on a $20 roll then you should be able to do the same with a $2,000 roll.
Important Notes
Make sure that you read / understand the risks outlined above. If you jump into this without understanding the unique risks that this system entails then you are going to have a bad time.
This indicator was developed around the 4h and that is where it works best. For crypto adjusting to higher TF’s will cause for bad results as the entries / exits will be late to the party. For traditional markets the Daily - Weekly time frames are preferred. It was not originally intended for smaller TF's but we have seen some good results on the 15m and 1h. The RSI can be a great compliment when using on smaller TF's. Adding a rule for not entering when RSI > 75 or < 25 and instead entering when RSI retests 50 will help to avoid some bad signals.
Alerts can be set for this indicator. Simply make sure that it is visible on the chart, then click the alert icon on the top panel. In the first dropdown set 'Condition' to 'EMASAR' and the second 'Condition' for the upcoming signal. For example if just entered long then set the second condition to 'Close Long' and you will be notified as soon as that signal occurs. If waiting for the next long entry then set the second condition to 'Open Long' so on and so forth . There is an 'All in One' alert that is also available. If you select that then you will be alerted any time that a signal occurs. The message will tell you to check the chart to see which signal caused the alert.
Portfolio Backtester Engine█ OVERVIEW
Portfolio Backtester Engine (PBTE). This tool will allow you to backtest strategies across multiple securities at once. Allowing you to easier understand if your strategy is robust. If you are familiar with the PineCoders backtesting engine , then you will find this indicator pleasant to work with as it is an adaptation based on that work. Much of the functionality has been kept the same, or enhanced, with some minor adjustments I made on the account of creating a more subjectively intuitive tool.
█ HISTORY
The original purpose of the backtesting engine (`BTE`) was to bridge the gap between strategies and studies . Previously, strategies did not contain the ability to send alerts, but were necessary for backtesting. Studies on the other hand were necessary for sending alerts, but could not provide backtesting results . Often, traders would have to manage two separate Pine scripts to take advantage of each feature, this was less than ideal.
The `BTE` published by PineCoders offered a solution to this issue by generating backtesting results under the context of a study(). This allowed traders to backtest their strategy and simultaneously generate alerts for automated trading, thus eliminating the need for a separate strategy() script (though, even converting the engine to a strategy was made simple by the PineCoders!).
Fast forward a couple years and PineScript evolved beyond these issues and alerts were introduced into strategies. The BTE was not quite as necessary anymore, but is still extremely useful as it contains extra features and data not found under the strategy() context. Below is an excerpt of features contained by the BTE:
"""
More than `40` built-in strategies,
Customizable components,
Coupling with your own external indicator,
Simple conversion from Study to Strategy modes,
Post-Exit analysis to search for alternate trade outcomes,
Use of the Data Window to show detailed bar by bar trade information and global statistics, including some not provided by TV backtesting,
Plotting of reminders and generation of alerts on in-trade events.
"""
Before I go any further, I want to be clear that the BTE is STILL a good tool and it is STILL very useful. The Portfolio Backtesting Engine I am introducing is only a tangental advancement and not to be confused as a replacement, this tool would not have been possible without the `BTE`.
█ THE PROBLEM
Most strategies built in Pine are limited by one thing. Data. Backtesting should be a rigorous process and researchers should examine the performance of their strategy across all market regimes; that includes, bullish and bearish markets, ranging markets, low volatility and high volatility. Depending on your TV subscription The Pine Engine is limited to 5k-20k historical bars available for backtesting, which can often leave the strategy results wanting. As a general rule of thumb, strategies should be tested across a quantity of historical bars which will allow for at least 100 trades. In many cases, the lack of historical bars available for backtesting and frequency of the strategy signals produces less than 100 trades, rendering your strategy results inconclusive.
█ THE SOLUTION
In order to be confident that we have a robust strategy we must test it across all market regimes and we must have over 100 trades. To do this effectively, researchers can use the Portfolio Backtesting Engine (PBTE).
By testing a strategy across a carefully selected portfolio of securities, researchers can now gather 5k-20k historical bars per security! Currently, the PTBE allows up to 5 securities, which amounts to 25k-100k historical bars.
█ HOW TO USE
1 — Add the indicator to your chart.
• Confirm inputs. These will be the most important initial values which you can change later by clicking the gear icon ⚙ and opening up the settings of the indicator.
2 — Select a portfolio.
• You will want to spend some time carefully selecting a portfolio of securities.
• Each security should be uncorrelated.
• The entire portfolio should contain a mix of different market regimes.
You should understand that strategies generally take advantage of one particular type of market regime. (trending, ranging, low/high volatility)
For example, the default RSI strategy is typically advantageous during ranging markets, whereas a typical moving average crossover strategy is advantageous in trending markets.
If you were to use the standard RSI strategy during a trending market, you might be selling when you should be buying.
Similarily, if you use an SMA crossover during a ranging market, you will find that the MA's may produce many false signals.
Even if you build a strategy that is designed to be used only in a trending market, it is still best to select a portfolio of all market regimes
as you will be able to test how your strategy will perform when the market does something unexpected.
3 — Test a built-in strategy or add your own.
• Navigate to gear icon ⚙ (settings) of strategy.
• Choose your options.
• Select a Main Entry Strat and Alternate Entry Strat .
• If you want to add your own strategy, you will need to modify the source code and follow the built-in example.
• You will only need to generate (buy 1 / sell -1/ neutral 0) signals.
• Select a Filter , by default these are all off.
• Select an Entry Stop - This will be your stop loss placed at the trade entry.
• Select Pyamiding - This will allow you to stack positions. By default this is off.
• Select Hard Exits - You can also think of these as Take Profits.
• Let the strategy run and take note of the display tables results.
• Portfolio - Shows each security.
• The strategy runs on each asset in your portfolio.
• The initial capital is equally distributed across each security.
So if you have 5 securities and a starting capital of 100,000$ then each security will run the strategy starting with 20,000$
The total row will aggregate the results on a bar by bar basis showing the total results of your initial capital.
• Net Profit (NP) - Shows profitability.
• Number of Trades (#T) - Shows # of trades taken during backtesting period.
• Typically will want to see this number greater than 100 on the "Total" row.
• Average Trade Length (ATL) - Shows average # of days in a trade.
• Maximum Drawdown (MD ) - Max peak-to-valley equity drawdown during backtesting period.
• This number defines the minimum amount of capital required to trade the system.
• Typically, this shouldn’t be lower than 34% and we will want to allow for at least 50% beyond this number.
• Maximum Loss (ML) - Shows largest loss experienced on a per-trade basis.
• Normally, don’t want to exceed more than 1-2 % of equity.
• Maximum Drawdown Duration (MDD) - The longest duration of a drawdown in equity prior to a new equity peak.
• This number is important to help us psychologically understand how long we can expect to wait for a new peak in account equity.
• Maximum Consecutive Losses (MCL) - The max consecutive losses endured throughout the backtesting period.
• Another important metric for trader psychology, this will help you understand how many losses you should be prepared to handle.
• Profit to Maximum Drawdown (P:MD) - A ratio for the average profit to the maximum drawdown.
• The higher the ratio is, the better. Large profits and small losses contribute to a good PMD.
• This metric allows us to examine the profit with respect to risk.
• Profit Loss Ratio (P:L) - Average profit over the average loss.
• Typically this number should be higher in trend following systems.
• Mean reversion systems show lower values, but compensate with a better win %.
• Percent Winners (% W) - The percentage of winning trades.
• Trend systems will usually have lower win percentages, since statistically the market is only trending roughly 30% of the time.
• Mean reversion systems typically should have a high % W.
• Time Percentage (Time %) - The amount of time that the system has an open position.
• The more time you are in the market, the more you are exposed to market risk, not to mention you could be using that money for something else right?
• Return on Investment (ROI) - Your Net Profit over your initial investment, represented as a percentage.
• You want this number to be positive and high.
• Open Profit (OP) - If the strategy has any open positions, the floating value will be represented here.
• Trading Days (TD) - An important metric showing how many days the strategy was active.
• This is good to know and will be valuable in understanding how long you will need to run this strategy in order to achieve results.
█ FEATURES
These are additional features that extend the original `BTE` features.
- Portfolio backtesting.
- Color coded performance results.
- Circuit Breakers that will stop trading.
- Position reversals on exit. (Simulating the function of always in the market. Similar to strategy.entry functionality)
- Whipsaw Filter
- Moving Average Filter
- Minimum Change Filter
- % Gain Equity Exit
- Popular strategies, (MACD, MA cross, supertrend)
Below are features that were excluded from the original `BTE`
- 2 stage in-trade stops with kick-in rules (This was a subjective decision to remove. I found it to be complex and thwarted my use of the `BTE` for some time.)
- Simple conversion from Study to Strategy modes. (Not possible with multiple securities)
- Coupling with your own external indicator (Not really practical to use with multiple securities, but could be used if signals were generated based on some indicator which was not based on the current chart)
- Use of the Data Window to show detailed bar by bar trade information and global statistics.
- Post Exit Analysis.
- Plotting of reminders and generation of alerts on in-trade events.
- Alerts (These may be added in the future by request when I find the time.)
█ THANKS
The whole PineCoders team for all their shared knowledge and original publication of the BTE and Richard Weismann for his ideas on building robust strategies.
═════════════════════════════════════════════════════════════════════════

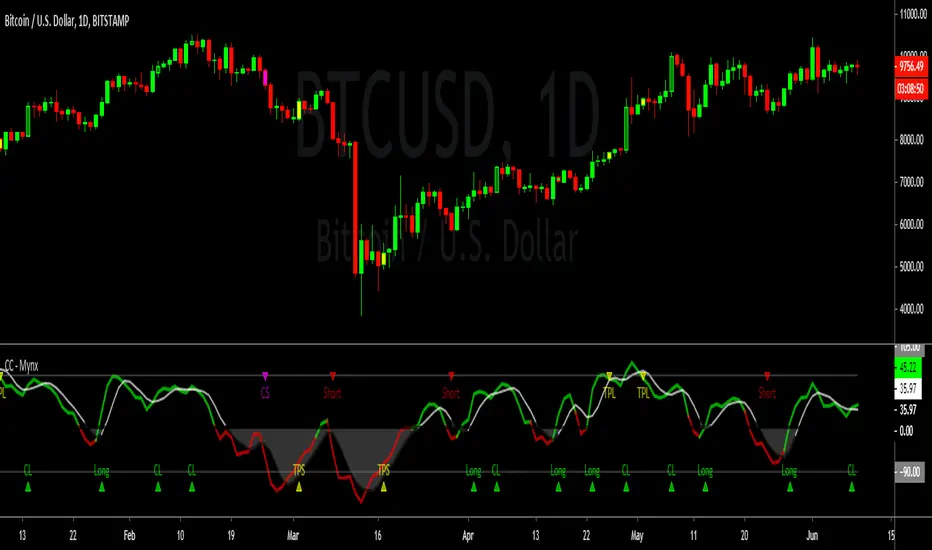
Cracking Cryptocurrency - MynxCracking Cryptocurrency - Mynx
Mynx is a powerful trend-following indicator which logic built in to facilitate nuanced aspects of PTP strategy. Continuation Trades, Early Exit Signals and Full Take Profit Signals are all built into Mynx. Mynx is designed to identify when the market is signaling that a trend is beginning as well as signalling when you may safely re-enter into a pre-existing trend. It also tells you where to exit prematurely to avoid significant capital loss on a losing trade, and when to take full profit in order to get out of a position at maximum profitability.
Should you have difficulty adding it you can search for 'Cracking' in the indicator window of your Trading View Platform, and it will appear along with the rest of our indicators.
As you will notice, Mynx is similar in nature to Time Transformation, in that it is both a Centered Oscillator and a Line Cross Indicator. This allows a wide range of possibilities which we will exploit to extract profit out of the market.
The most important line is the BPM or Mynx Line. This is going to be the thicker, brighter colored line on our indicator that will switch from green to red depending on the dominant trend. The color changing feature of this line will denote where our indicator is in relation to our zero line. If our BPM Line is green, then price is trading above our zero line, if red than it is trading below. Therefore we can quickly see what our last signal was, and whether our indicator is bullish or bearish depending upon the color of our BPM Line. If Green, we are in long territory, if red we are looking for shorts.
Our second area of importance in this indicator is our Noise Line and Area. This is the black or white line which will change color depending on where Noise is relative to our zero line. Black if above the zero line, meaning we are in long territory, and white if below, indicating we are in shorting territory. The area between the zero line and the Noise Line is shaded black or white as well, and denotes no-trade zones for us. If our BPM Line is within our Noise Area, we are not in a trade. We are only in a trade when our BPM Line is breaking away from Noise Line, either to the upside or the downside. When BPM curls back and re-enters our Noise Area, that is an indication to exit our position regardless of our Take Profits or Stop Losses.
Our Zero Line is indicated by a thick black line for easy of identification, which will be our primary signal generator when our BPM Line crosses above or below it, and our faint gray lines are going to be our Overbought and Oversold levels respectively. These will play a function in how we take profits.
Settings
Let's take a look at the settings of our Mynx Indicator.
The first field we will see is our BPM Source, how many beats per minute we want in our cycle length. The default is ten, and through back-testing I find this to be the optimum level.
Our Noise Filtration level corresponds to our Noise Line and Area. Again, I find the default settings as I have programmed them work best on all time frames, however you might find optimum signals by playing around with these settings. As in all things, nuance and experimentation is what excellence is borne of.
We can adjust our Oversold and Overbought Parameters, making it easier or harder for us to get a Full Take Profit Signal from this indicator. We can also adjust our Base Line. Keep in mind, our Base Line is going to be an Exponential Moving Average and here we can adjust the length of our desired Base Line.
To incorporate our Multi-Time Frame feature, below this section we can see that the default option will be to use a Base Line of the current time frame. If however, we want to trade on a Lower Time Frame and reference a base line of another time frame, we can simply un-check that box and input the desired Time Frame of the Base Line we wish to reference.
Now for the true appeal of Mynx in user friendliness, below this we can see that we have full control of the signals we want Mynx to generate for us. By default, we have enabled Mynx's best signals, Trending Signals. We can choose to plot Continuation Crosses and Reversals Within the Trend, both of which are trades we are allowed to take and I recommend taking in a proper PTP system. We can choose to use Mynx as a reversal indicator, to plot Raw Reversals against the trend, which I do not recommend enabling unless you want to by pass PTP entirely. We can choose to plot when Mynx gives us a Full Take Profit signal, a signal to take full profits on our position. We also have the option to plot for early exits. The Option for Sensitive Stop Loss is the same as early exits, and will plot an exit signal every time the BPM Line drifts back into the Noise Area. These are fairly easy to see upon bar closes, so I left it disabled by default. If you enable it you will get a visual signal to exit your position upon a bar close.
One final note, we can adjust the source upon which Mynx is basing her signals. By default, this value is hl2 , which I found in back-testing to be the most efficient with minimum draw down. However, there is a higher profit potential with HLC3 and OHLC4, but be warned that with that extra profit potential comes the risk of more draw down. The draw down settles out in the end, however there will be months where you drastically under perform Alpha, where as hl2 keeps you consistently outperforming the market at all times. This is a very personal choice, and I leave it upon you to make the right one.
In our Style Tab, we can adjust our Color Scheme to better accommodate the way that you trade. I have done my best to be very concise and detailed in labeling to make this task easy.
Strategy
Please let me know of your success stories with Mynx, as well as any features you think would be helpful to add. If you notice any errors within it, please notify me so I can fix them. I have back-tested this strategy many times in many different settings, and it consistently outperforms the market and generates Alpha. I now place it within your hands to achieve the same results. Trade Safely.
BKN: Thick CutThick Cut is the juiciest BKN yet. This indicator is created to take a profitable trading strategy and turn it into an automated system. We've built in several pieces that professional traders use every day and turned it into an algo that produces on timeframes as low as 1, 3, and 5 minutes!
Limit Order Entries: When criteria is met, an alert is signaled that will send a value to enter a position at a limit price.
Built in Stop Loss: A stop is built in and the value can be sent to your bot using the {{plot}} function or you can rely on a TradingView alert when the stop is hit.
Built in Take Profits: We've built in two separate take profits and the ability to move your stop loss to breakeven after the first take profit is hit. Even if you take 50% profit at 1R and move your stop loss, you already have a profitable trade. Test results show 50% profits at 2R and the remainder at higher returns result in exceptional results.
Position Sizing: We've built in a position size based on your own predetermined risk. Want to risk $100 per trade? Great, put in 100 in the inputs and reference a quantity of {{plot("Position Size")}} in your alert to send a position size to the bot. You can also reference {{plot("Partial Close")}} to pull 50% of the position size closing 50% at TP1 and 50% at TP2.
Backtest results shown are very short term since we are viewing a 15m chart. This can be a profitable strategy on many timeframes, but lower timeframes will maximize results.
A unique script with incredible results. Further forward testing is live.
***IMPORTANT***
For access, please do not comment below. Comments here will not be replied to. Please send a DM here or on my linked Twitter . At this time, this strategy is considered a Beta release as we continue to fine tune settings and more. Expecting 2 weeks of beta with official release around June 6.
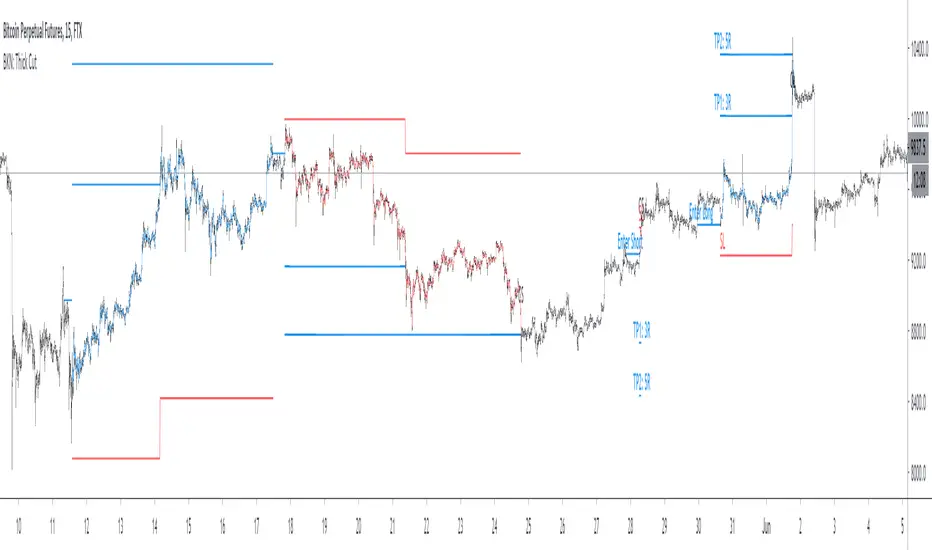
EMASARPLEASE READ THE FULL DESCRIPTION BEFORE BUYING OR USING THIS INDICATOR
EMASAR (pronounced Emma-sar) is a strategy based on Exponential Moving Averages and the Parabolic SAR . This is a position trading approach that is derived from Tyler Jenks’ Consensio.
This strategy was developed with four objectives in mind: (1) managing risk (2) protecting from missing out on major moves (3) maximizing risk:reward (4) staying in a trending market and taking profit before it fully reverses.
EMASAR does a great job at accomplishing all of the above through the buy and sell signals that are generated. The data provided below is from the signals that occurred on Bitcoin (Bitstamp) from January 1, 2015 to present (November 11, 2019).
(1) Risk is tightly managed, relative to the winners, and losing positions will be exited before the market moves too far against.
The biggest losing trade on Bitcoin, for the time period outlined above, is -18.47%.
(2) Following the EMASAR buy and sell signals guarantees that one will not miss out on a major trend. As a result of the indicators used for this system it is mathematically impossible for a major trend to occur without providing a buy or sell signal. This system isn't meant to catch exact tops or bottoms but it will do a great job of capturing ~85% of a trend.
(3) On average the winning trades will be 5.55 times the losing trades. There will be stretches where the losers are bigger than the winners and this could last for many months, maybe even a year. However, over the long run the average reward is expected to be 5.55 times the average risk*.
*Past performance does not guarantee future results!
(4) This indicator was designed to capitalize on parabolic markets, specifically Bitcoin and alt coins. Crypto markets have a tendency to get moving so fast that many indicators become all but useless.
Entries can get signaled too late and exits will get signaled way too early. This is specifically true when using oscillators that are designed to identify overbought or oversold environments. EMASAR does a great job of keeping us in a position for the duration of a trend and this includes the major parabolic runs that Bitcoin has a tendency to go on.
Take a look at the two charts below which illustrates the buy and sell signals that occurred at the beginning and end of the 2017 and 2019 parabolic moves. Green = Buy | Blue = Exit | Red = Short
Long signaled at $4,190.27 on September 29th, 2017
Exit signaled at $13,647 on January 14th, 2018
Short signaled at $12,050 on January 16th, 2018
Close Short signaled at $3,684 on February 18th, 2019
Long signaled at $3,684 on February 18th, 2019
Exit signaled at $9,614 on July 16th, 2019
Short signaled at $10,328 on July 22nd, 2019
When Bitcoin, or other alts, really get moving it can be very difficult to distinguish between a correction and a full reversal. We do not want to be exiting during a minor correction, instead this is a time when we want to be holding on or looking to buy the dip.
This is a very fragile balance. The market has a very strong tendency to make corrections looks like reversals and to make reversals look like corrections. Therefore it is very important to have a tool(s) that you trust to distinguish in between the two.
I believe that EMASAR is the best way to find that balance - if I knew of a better way then I would be using it instead!
Following these signals will help us to hold onto positions while the market is still trending in our favor when most think that it has moved too far / too fast, and it will also get us out before a market fully reverses.
Keep in mind that there will be times when we exit a market that is in danger of reversing, only to buy back higher later on. That is okay because it enables us to properly manage risk during times of uncertainty and buying back in at a higher price is more than worth the opportunity cost.
Lets look at the signals above in chronological order:
1) Close Long: $2,274
2) Open Short: $2,347
3) Exit Short: $2,934
4) Open Long: $2,766
5) Close Long: $3,124
6) Enter Long: $4,190
A long was closed at $2,274 after Signal #1 and was re-entered after Signal #4 at $2,766. Additionally a long was closed at $3,124 after Signal #5 and was re-entered on the following signal at $4,190. These are examples of some of the bad signals that will occur. Something to pay attention to is the ratio of the risk to the reward. When the market turns against us EMASAR will quickly signal an exit or a re entry.
EMASAR also works great in traditional markets. The S&P 500 has been on a tear lately after creating new all time highs in October of 2019. It has resumed it's strong bull trend and therefore it is a great market to have long exposure to. That being said we are well overdue for a correction and most people, including myself, expect the next bear market to be much more severe than the last two. Therefore I would not want to have long exposure unless equipped with a very reliable method for taking profit before it fully reverses.
Let's take a look at the S&P 500 weekly EMASAR signals using the preferred settings outlined below:
In August of 1990 EMASAR signaled a 'Close Long' at $308. At that time the market was in danger of fully reversing. When that didn't happen EMASAR gave a signal to re enter at $369 which resulted in losing 19.8% in opportunity cost. That is quite okay because it would have allowed us to properly protect ourselves in the event that the market proceeded to crash. Instead we entered a massive bull market that culminated in the dot com bubble. Notice how EMASAR kept us in for the entire duration of that bull run and then signaled an exit very close to the top at $1,294. It got us back in by the end of 2004 after the market had bottomed. Yet again it kept us in for the following multi year bull market before signaling an exit very close to the top at $1,270.
The action that followed in 2016 looks very similar to what happened in 1990 - 1991. An exit was signaled when the market was in danger of fully reversing. When that didn't happen a re entry was signaled 14% higher. Now the market appears to be taking off in another parabolic advance. There is no way to know how far this next run will go or how long it will last. Nevertheless I feel highly confident that I will be able to hold on for the majority of the trend and then get fully out before it reverses thanks to the signals provided by EMASAR.
When looking at the signals on Gold we will notice striking similarities to the signals in the S&P 500 as well as Bitcoin.
Notice how an entry was signaled very close to the bottom at $323 in June of 2002. An exit was also signaled very close to the top at $1,441 in April of 2013. Throughout that runup there was one bad signal that cost some opportunity. It's very important to understand that missing out on opportunity is well worth the price because it allows us to effectively manage risk. EMASAR also recently provided a long signal at $1,401 which preceded this recent runup.
Settings
Default settings work best for crypto, however the time multiplier should be adjusted for markets that are not open 24/7. For commodities and FOREX my default is 40 and for stocks I use 24. The Moving Averages can be adjusted as well. The period can be changed and you can also select SMA or EMA. I always use the EMA's and strongly prefer the 50 and 200. We have noticed good results with the 9 and 54 EMA's as well. The shorter the period that the Moving Average is set to the more frequent the signals will be. This will generally improve risk:reward while decreasing strike rate. For crypto the best time frames are the 4h and 6h. For traditional markets the best time frames are the Daily, 3D and Weekly. EMASAR can be used on smaller time frames as well, specifically in crypto. The 15m and 1h have shown good results.
Risks
The biggest risks with trading EMASAR revolve around disobeying the signals. Risk management is built into this system with the exit signals that will occur, however it is up to the individual to execute those signals. Passing on an exit signal could lead to a big loss which would have a dramatic impact on the ROI. Most trading systems will have small and medium losses with small, medium and large wins. That is exactly how this works. The small - medium losses and wins will mostly be a wash and will account for roughly 80% of the trades. The large wins will happen about 20% of the time and will make up 80% - 90% of the profits.
Therefore the two biggest risks are passing on signals entirely, or exiting preemptively. Getting chopped in and out of a market can be quite frustrating. If you become overwhelmed with negative emotions then it could cause you to pass up on the next signal. That signal will often be the one that more than makes up for the small - medium losses that preceded.
On average EMASAR will provide one signal every 6 weeks when using the default settings on the 4h chart. Therefore missing one entry could turn an otherwise profitable year into a loser. If electing to trade a system, whether it is EMASAR or another, it is crucial to commit to taking every signal regardless of outside variables (namely your personal bias about market direction or frustration that follows a losing stretch).
Another major risk with this system is taking too much profit too soon. When getting into a trade that has the potential to be a big winner it can be challenging to continue holding through the swings. Anyone that has watched paper profits vanish will be inclined to start exiting after the market makes a big move in his or her favor. While this is better than watching profits completely evaporate, this mistake can be enough to turn a profitable system into one that loses to the market. If 80% - 90% of our profits come from 10% - 20% of our trades then it is vital we do not cut those positions off at the knees.
If taking too much profit too soon then you will consistently turn potential large winners into medium winners. This may lead to making money over the long run which will make it very difficult to realize that anything is wrong. However making money and beating the market are two very different things. Exiting early and making money is nearly as big of a risk as missing entries entirely.
If you have the discipline to execute signals in a timely manner after they are triggered and the emotional control to let the winners run despite the appearance of a vastly overbought / oversold market, then you should have what it takes to beat the market with EMASAR.
If you are not an experienced trader then it is very important to start out small. The only way to learn is to trade in a live environment and the only way to succeed is to risk much less than you can afford to lose. If you have $2,000 to trade with then start with a maximum position size of $20 - $50 and don’t be shy about scaling that down even further. Focus on ROI instead of actual dollars made. If you can return 100% on a $20 roll then you should be able to do the same with a $2,000 roll.
Important Notes
Make sure that you read / understand the risks outlined above. If you jump into this without understanding the unique risks that this system entails then you are going to have a bad time.
This indicator was developed around the 4h and that is where it works best. For crypto adjusting to higher TF’s will cause for bad results as the entries / exits will be late to the party. For traditional markets the Daily - Weekly time frames are preferred. It was not originally intended for smaller TF's but we have seen some good results on the 15m and 1h. The RSI can be a great compliment when using on smaller TF's. Adding a rule for not entering when RSI > 75 or < 25 and instead entering when RSI retests 50 will help to avoid some bad signals.
Alerts can be set for this indicator. Simply make sure that it is visible on the chart, then click the alert icon on the top panel. In the first dropdown set 'Condition' to 'EMASAR' and the second 'Condition' for the upcoming signal. For example if just entered long then set the second condition to 'Close Long' and you will be notified as soon as that signal occurs. If waiting for the next long entry then set the second condition to 'Open Long' so on and so forth. There is an 'All in One' alert that is also available. If you select that then you will be alerted any time that a signal occurs. The message will tell you to check the chart to see which signal caused the alert.
How to Buy
The EMASAR Indicator is available for purchase on my website. The link can be found in my signature or in the tagline of my Trading View profile.
The price is $500 per year which is only payable in Bitcoin. That also includes access to a private Telegram group.

Profit-sync script for TrexenThere are various scripts and indicators on Tradingview, but not many of them combine theories to improve the profitability of an indicator using settings from multiple time frames.
This script takes the Average True Range trailing exit idea to enter trades. Many other ideas have been tested to filter entry signals which may be weak or not profitable such as a second ATR with Higher TF, MFI/VFI, RSI, Momentum wavetrend, Weis Wave, MACD, Stochastic etc, but I felt the following works best:
- Over the ATR entries there is a directional filter very similar to Renko candles which can be set to a higher time frame, I use 4 hour with 15 min candles for example, this will only allow 15 min buy signals to execute if the 4 hour is also on the buy side.
- There is also a Trend directional filter which can be set to a higher/lower time frame, currently I am using this on allow setting to allow more trades
The higher both filter are, the more accurate the trades will be, but less frequent. The filters convert entry signals into exit signal which can be used as take profit point with alerts if there is a position open.
The overall theory is to follow trend and to exit with profit. I have tested different take profit alerts but think it’s better to either catch a whole price move or sell with a set trailing limit order at like 0.4/0.5%.
As I am trading BTC with a bot and not with TA I think it is good to get in on a trend reversal, follow the trend up and get out quick with profit. There is a lot of manipulation with crypto so things like Momentum indicators and money-flow may not represent what is actually happening in the market.

Multi-Entry Fibonacci CalculatorMulti-Entry Fibonacci Calculator
This tool is a comprehensive trade calculator designed for discretionary traders who plan to scale into positions. It automates the complex task of position sizing across up to three separate entries while ensuring your total risk exposure remains fixed. By inputting your desired entry, stop loss, and initial profit target levels, the script calculates the precise quantity for each entry and provides a dynamic, real-time view of your trade's vitals.
The primary goal of this script is to allow for disciplined risk management in multi-entry trade plans. Whether you are averaging into a position or adding on pullbacks, this tool ensures your total predefined risk is never exceeded, even if all entries are filled.
Key Features
Multi-Entry Position Sizing: Automatically calculates the share/contract size for up to three entries based on their distance from the stop loss and user-defined weights.
Fixed Risk Management: Define your total risk as a percentage of your account. The script ensures that a full stop-out across all filled entries will result in a loss equal to this predefined amount.
Dynamic Take Profit: The take-profit level automatically adjusts based on your current average entry price to preserve the original target profit amount in dollars.
Real-Time Info Panel: A customizable on-chart panel displays all critical trade data, including current quantity, average price, projected P&L, and trade status.
Visual Trade Plan: Plots all your defined price levels (entries, stop loss, take profit) directly on the chart with informative labels.
Trade State Tracking & Alerts: The script monitors the price and will trigger alerts when entries are hit, or when the stop loss or take profit levels are reached.
How to Use
Configure Account & Risk: In the settings, enter your "Account Size" and the "Risk per Trade (%)" you are willing to take on the entire position.
Set Trade Direction: Choose either "LONG" or "SHORT".
Input Price Levels: Manually enter the prices for your entries (Entry 1, 2, 3), your "Stop Loss Price," and an "Initial TP Reference." The initial TP is used to calculate the target profit in dollars.
Distribute Position Weight: Assign weights to each entry (e.g., 50% for Entry 1, 30% for Entry 2, 20% for Entry 3). The total should sum to 100.
Monitor the Trade: Use the info panel and on-chart visuals to track the trade's progress. The script will show your average price as entries are filled and update the dynamic take-profit level accordingly.
Understanding the Calculations
Weighted Position Sizing: The script calculates sizes for each entry so that if all entries are filled and the stop loss is hit, your total loss will equal your predefined risk amount. It intelligently allocates size based on the distance of each entry from the stop loss and the weight you assign to it.
Dynamic Take Profit: The "Initial TP Reference" is used only to calculate a target profit in dollars based on your first entry's size. The script then calculates a dynamic TP line on your chart. This line adjusts based on your average entry price as positions are filled, ensuring that if price reaches this level, you will realize your original target dollar profit, regardless of how many entries were filled.
On-Chart Elements
Price Lines: Blue lines for entries, a red line for the stop loss, and a green line for the dynamic take profit.
Labels: Display the calculated quantity for each entry, the total risk amount at the stop loss, and the target profit amount at the take profit.
Average Price: Yellow circles plot your live average entry price as the position is built.
Info Panel: A comprehensive table showing live trade status, current quantity, average price, and projected profit/loss. The panel changes color to green on a TP hit and red on an SL hit.

Nexural ORB Nexural ORB - Multi-Timeframe Opening Range Breakout Indicator
Introduction
This indicator was built out of frustration. After testing dozens of ORB tools, both free and paid, I found that most of them either did too little or cluttered the chart with unnecessary information. The Opening Range Breakout is one of the oldest and most reliable intraday strategies, yet most indicators treat it as an afterthought - just a box on the chart with no context.
This is not that kind of indicator.
The Nexural Ultimate ORB tracks the Opening Range across three timeframes simultaneously, provides quality scoring to help you identify high-probability setups, detects when multiple levels align for confluence, and now includes historical ORB data so you can scroll back and review previous sessions. It does not tell you when to buy or sell. It does not promise profits. What it does is give you clean, accurate levels with the context you need to make informed decisions.
I am going to be completely transparent about what this indicator does, how it works, what it does well, and where it falls short. If you are looking for a magic solution that prints money, this is not it. If you are looking for a professional-grade tool that will become a permanent part of your charting setup, keep reading.
What Is The Opening Range Breakout
Before diving into the indicator itself, let me explain the strategy it is built around.
The Opening Range is simply the high and low price established during the first portion of the trading session. For US equities and futures, this typically begins at 9:30 AM Eastern Time. The theory behind trading the Opening Range is straightforward: the first 15, 30, or 60 minutes of trade often sets the tone for the rest of the day. Institutional traders, algorithms, and market makers are all actively positioning during this window, and the levels they establish become reference points for the remainder of the session.
When price breaks above the Opening Range High, it suggests bullish momentum and the potential for continuation higher. When price breaks below the Opening Range Low, it suggests bearish momentum and the potential for continuation lower. The strategy has been used by floor traders for decades and remains relevant today because the underlying market dynamics have not changed - the open is when the most information gets priced in, and the levels established during that period matter.
This indicator does not trade the ORB for you. It identifies the levels, tracks multiple timeframes, and provides context. The actual trading decisions are yours.
How The Opening Range Is Calculated
The indicator calculates the Opening Range for three timeframes:
The 15-Minute ORB captures the high and low from 9:30 AM to 9:45 AM. This is the shortest timeframe and typically produces the tightest range. Breakouts from the 15-minute ORB tend to occur earliest in the session and can provide early directional signals, though they are also more prone to false breakouts due to the narrow range.
The 30-Minute ORB captures the high and low from 9:30 AM to 10:00 AM. This is considered by many institutional traders to be the most significant timeframe. The 30-minute window allows enough time for the initial volatility to settle while still capturing the core opening activity. Many professional trading desks reference the 30-minute ORB as their primary intraday framework.
The 60-Minute ORB captures the high and low from 9:30 AM to 10:30 AM. This is the widest range and produces fewer signals, but those signals tend to be more reliable. The 60-minute ORB is particularly useful on high-volatility days when the 15 and 30-minute ranges get quickly violated.
The calculation itself is simple. As each bar completes during the opening period, the indicator compares the current high and low to the stored values and updates them if new extremes are reached. Once the timeframe completes, the levels lock in and do not change for the rest of the session.
I want to be absolutely clear about one thing: there is no repainting. The ORB levels are calculated in real-time as the opening period develops. Once a timeframe completes, those levels are final. You will not look back at your chart and see different levels than what appeared in real-time. This is critically important for any indicator you use for actual trading decisions.
Visual Hierarchy and Line Styles
One of the main problems with multi-timeframe indicators is visual clutter. When you have six lines on the chart representing three different ORBs, it becomes difficult to quickly identify which level belongs to which timeframe.
This indicator solves that problem through a clear visual hierarchy. Each timeframe has its own color, line width, and line style, all of which are fully customizable.
By default, the 15-Minute ORB uses solid lines with the heaviest weight. This makes it the most prominent on the chart because it is typically the first level to be tested and often the most actively traded.
The 30-Minute ORB uses dashed lines with a medium weight. This keeps it visible but clearly secondary to the 15-minute levels.
The 60-Minute ORB uses dotted lines with a medium weight. This places it in the background as a reference level rather than an active trading zone.
You can change any of these settings. If you prefer to trade the 30-minute ORB exclusively, you can make it solid and bold while keeping the others subtle. If you only want to see the 60-minute ORB, you can disable the other two entirely. The flexibility is there because every trader has different preferences.
The dashboard in the top right corner of the chart displays the corresponding line style next to each timeframe, so you always know which line on the chart matches which row in the dashboard.
The Quality Scoring System
Not every Opening Range is worth trading. Some days produce tight, clean ranges with strong follow-through. Other days produce wide, choppy ranges that lead to multiple false breakouts. One of the most valuable features of this indicator is the Quality Score, which grades each session from A-plus down to C.
The Quality Score is calculated based on several factors:
Range Size is the most important factor. The indicator compares the current ORB range to the average daily range over the past 20 sessions. A tight range, defined as less than 40 percent of the average daily range, receives the highest score. The logic here is simple: tight ranges indicate consolidation, and consolidation often precedes expansion. When the ORB is tight, a breakout has more room to run.
A normal range, between 40 and 80 percent of the average daily range, receives a moderate score. These are typical trading days without any particular edge from a range perspective.
A wide range, greater than 80 percent of the average daily range, receives the lowest score. When the ORB is already wide, much of the day's move may have already occurred during the opening period, leaving less opportunity for breakout continuation.
Volume is the second factor. Above-average volume during the opening period indicates genuine institutional participation. The indicator compares the current volume to the 20-bar average. Significantly elevated volume adds to the quality score, while below-average volume does not penalize the score but does not help it either.
Day of Week matters more than most traders realize. Statistical studies of market behavior consistently show that Tuesday, Wednesday, and Thursday produce cleaner trending days than Monday or Friday. Monday mornings often see erratic price action as the market digests weekend news and repositions. Friday afternoons often see reduced participation as traders close out positions before the weekend. The quality score reflects these tendencies by adding points for mid-week sessions and subtracting points for Monday mornings and Friday afternoons.
Overnight Activity is relevant primarily for futures traders. If the overnight session produced a significant range, defined as greater than half of the average true range, it suggests that institutions were active during the overnight hours. This often leads to more directional behavior during the regular session.
The quality score is displayed in the dashboard as a letter grade. A-plus indicates excellent conditions across multiple factors. A indicates good conditions. B indicates average conditions. C indicates below-average conditions that warrant caution.
I want to be honest about the limitations of this system. The quality score is a guideline, not a guarantee. A C-rated day can still produce a profitable breakout. An A-plus day can still result in a failed breakout that reverses. The score helps you calibrate your expectations and position sizing, but it does not predict the future.
Confluence Detection
Confluence occurs when multiple significant price levels cluster together within a tight range. When the 15-minute ORB high aligns with the overnight high, or when the ORB low sits right at the session opening price, you have confluence. These zones tend to produce stronger reactions because multiple types of traders are watching the same level.
The indicator automatically detects confluence using a tolerance-based system. By default, the tolerance is set to 0.15 percent of price. This means that if two levels are within 0.15 percent of each other, they are considered confluent.
The levels that are checked for confluence include the Session Opening Price, which is the exact price at 9:30 AM. This level matters because it represents the point where the market transitioned from overnight to regular session trading. Many traders reference the opening print throughout the day.
The Overnight High and Low are also checked. For futures markets, this includes all trading from 6:00 PM the previous evening through 9:29 AM. For stocks, this includes extended hours trading. These levels represent the extremes established before the regular session began.
Finally, the indicator checks whether the ORB levels from different timeframes align with each other. When the 15-minute high matches the 30-minute high, that level gains additional significance.
When confluence is detected, two things happen on the chart. First, the affected ORB line changes color to gold, making it visually obvious that this level has additional significance. Second, the dashboard displays a Confluence row at the bottom, alerting you to the condition.
The Confluence label also appears directly on the chart, positioned within the ORB zone so you can immediately see where the confluence exists.
Smart Label System
A common problem with indicators that display multiple price levels is label overlap. When you have six ORB levels plus auxiliary levels like the session open and overnight high and low, the right side of the chart can become a cluttered mess of overlapping text.
This indicator solves that problem with a smart labeling system that combines matching levels. If the 15-minute low, 30-minute low, and 60-minute low are all at the same price, instead of displaying three separate labels, the indicator displays a single label that reads 15L/30L/60L followed by the price.
The system uses a tolerance of 2 percent of the ORB range to determine whether levels are close enough to combine. This keeps the labels clean while still displaying separate labels when levels are meaningfully different.
The labels are positioned to the right of the current price action, extending beyond the last bar so they remain visible as new bars form. Each label includes the level identifier and the exact price value.
Historical ORB Display
This feature addresses one of the most common limitations of ORB indicators: the inability to see previous sessions when scrolling back through your chart.
With the history feature enabled, the indicator stores ORB data for up to 20 previous sessions. When you scroll back in time, you will see the ORB levels for each historical session, drawn from the session start to the session end.
Historical ORBs are displayed with slightly faded colors, using 50 percent transparency compared to the current session. This creates a clear visual distinction between current and historical levels while still allowing you to analyze past price action relative to those levels.
The history depth is configurable. You can set it anywhere from 1 to 20 days depending on your needs. If you primarily care about the current session and the previous day for context, set it to 1 or 2. If you want to analyze an entire week or more of ORB behavior, increase the setting.
You can also disable the history feature entirely by enabling Current Session Only mode. This returns the indicator to showing only the active session, which some traders prefer for a cleaner chart during live trading.
Breakout Detection and Filters
The indicator marks breakouts with triangle signals. A green triangle below the bar indicates a bullish breakout above the ORB high. A red triangle above the bar indicates a bearish breakout below the ORB low.
However, not every crossing of an ORB level represents a valid breakout worth acting on. The indicator includes several filters to reduce false signals.
The Volume Filter requires that volume on the breakout bar be at least 1.2 times the 20-bar average volume. You can adjust this multiplier in the settings. The logic is straightforward: breakouts on weak volume are more likely to fail. A genuine breakout that is going to follow through should be accompanied by above-average participation.
The Time Filter prevents breakout signals after a specified hour. The default is 2:00 PM Eastern. The rationale is that late-session breakouts often lack follow-through because there is not enough trading time remaining for the move to develop. You can adjust or disable this filter based on your trading style.
The Single Trigger mechanism ensures that each breakout fires exactly once per session. If price crosses above the ORB high, you will see one bullish signal on the bar where the crossing occurred. If price subsequently pulls back and crosses above again, you will not see a second signal. This prevents signal spam and keeps your chart clean.
The indicator also includes Reclaim Detection. If price breaks out and then returns back inside the ORB zone, you will see a warning signal marked with an X. This condition often indicates a failed breakout and potential reversal. It is not a trade signal, but rather information that the breakout you just witnessed may not be valid.
Range Extensions
Once the ORB is established, many traders look for profit targets based on the range itself. The indicator includes extension levels that project multiples of the ORB range above and below the extremes.
By default, two extension levels are shown: 1.0 times the range and 1.5 times the range. If the 15-minute ORB is 50 points, the 1.0 extension above the high would be 50 points above the high, and the 1.5 extension would be 75 points above the high.
These extensions serve as potential profit targets for breakout trades. The 1.0 extension represents a measured move equal to the ORB itself. The 1.5 extension represents a slightly more ambitious target.
You can adjust the extension multipliers in the settings. Some traders prefer 0.5 and 1.0. Others prefer 1.0 and 2.0. The flexibility is there to match your trading approach.
The extension lines are displayed as faint dotted lines so they do not compete visually with the ORB levels themselves. The labels show the multiplier value along with the exact price.
## The Midline
The 50 percent level of the ORB, known as the midline, is displayed as a dashed line within the ORB zone. This level matters because it often acts as short-term support or resistance during consolidation periods within the range.
When price is trading inside the ORB and approaches the midline, you may see a reaction. The midline can also serve as a reference for whether price is showing strength or weakness within the range. If price is spending most of its time above the midline, that suggests a bullish bias even before a breakout occurs. If price is spending most of its time below the midline, that suggests a bearish bias.
The midline can be disabled in the settings if you prefer a cleaner chart.
The Dashboard
The dashboard is positioned in the top right corner of the chart and provides all relevant ORB information at a glance.
The header row displays the indicator name, the current Quality Score grade, the Range Classification, and the Session Status.
The Range Classification shows whether the current 15-minute ORB is Tight, Normal, or Wide compared to the 20-day average. This gives you immediate context about whether the range is unusual in either direction.
The Session Status shows whether the market is currently in session or closed. A green Live indicator means the session is active. A red Closed indicator means the session has ended.
Below the header, each timeframe row displays the following information:
The Timeframe column shows 15m, 30m, or 60m along with a visual indicator of the line style you have selected for that timeframe.
The High column displays the ORB high price for that timeframe.
The Low column displays the ORB low price for that timeframe.
The Range column displays the distance between high and low.
The Status column shows the current state. Before the ORB completes, this shows a countdown of minutes remaining. After completion, it shows whether the price has broken out bullish, broken out bearish, or remains in range.
Below the timeframe rows, the Distance row shows how far the current price is from the nearest ORB level. This helps you gauge whether price is approaching a potential breakout zone.
If confluence is detected, a highlighted row appears at the bottom of the dashboard indicating that significant level alignment exists.
Supported Markets and Sessions
The indicator supports multiple market types with appropriate session times:
US Stocks use a session from 9:30 AM to 4:00 PM Eastern.
US Futures use a session from 9:30 AM to 4:00 PM Eastern, with overnight tracking from 6:00 PM the previous evening.
Forex uses a 24-hour session since the market trades continuously.
Crypto uses a 24-hour session since the market trades continuously.
Custom allows you to define your own session times for markets not covered by the presets.
The timezone is configurable. The default is America/New_York, but you can change it to Chicago, Los Angeles, London, Tokyo, or UTC depending on your location and preference.
Settings Overview
The settings are organized into logical groups:
General settings include the market type, current session only toggle, and history days.
Session settings include custom session times and timezone selection.
ORB Timeframes settings include individual toggles for showing or hiding each timeframe, color selection, line width, and line style. This is where you customize the visual appearance of each ORB level.
Quality Scoring settings include the ATR period and range comparison lookback. These affect how the quality score is calculated.
Confluence Detection settings include the tolerance percentage and toggles for the session open and overnight high and low levels.
Breakout Settings include the volume filter toggle and multiplier, time filter toggle and cutoff hour, and reclaim detection toggle.
Visuals settings include toggles for the fill zone, labels, dashboard, distance display, and midline.
Extensions settings include toggles for showing extensions and the multiplier values for each extension level.
How I Use This Indicator
I will share my personal approach, though you should adapt it to your own style.
First, I wait for the ORB to complete. I do not trade during the first 15 to 30 minutes of the session. The levels are still forming, and the price action during this window is often erratic. I let the dust settle and the range establish itself.
Second, I check the Quality Score. If it is an A or A-plus day with a tight range and good volume, I am more aggressive. If it is a C day with a wide range on a Friday afternoon, I am either sitting on my hands or trading with reduced size.
Third, I look for confluence. If the 15-minute high is sitting right at the overnight high, that level has additional significance. Breakouts through confluence zones tend to be more decisive.
Fourth, I confirm with volume. Even though the indicator filters for volume, I still glance at the volume bars. I want to see that breakout candle have conviction.
Fifth, I manage expectations based on range type. If the ORB is tight, I expect an explosive move and give the trade room to develop. If the ORB is wide, I expect choppier action and tighten my parameters.
Sixth, I use the distance reading. If price is already 50 points beyond the ORB high and the range was only 40 points, I have missed the move. Chasing extended price is not smart trading.
Honest Pros and Cons
What this indicator does well:
It provides clean, accurate ORB levels that do not repaint. This is the foundation, and it is done correctly.
It offers multi-timeframe tracking with clear visual differentiation. You can see all three ORBs at once without confusion.
The quality scoring system helps you avoid low-probability setups. It is not perfect, but it adds valuable context.
The confluence detection highlights significant level alignment automatically. This saves you from manually checking multiple levels.
The smart label system prevents visual clutter. Labels combine when appropriate and remain readable.
The historical ORB display allows you to scroll back and review previous sessions. This is valuable for analysis and pattern recognition.
The customization is extensive. Every visual element can be adjusted to match your preferences.
It works across stocks, futures, forex, and crypto with appropriate session handling.
What this indicator does not do:
It does not give you buy and sell signals with entries and exits. This is a levels and analysis tool, not a trading system.
It does not include backtesting or performance tracking. You need a separate strategy tester for that.
It does not guarantee that breakouts will follow through. The filters help, but failed breakouts still occur.
The quality score is a guideline, not a prediction. Low-quality days can still produce good trades. High-quality days can still produce losing trades.
The confluence detection is proximity-based. It identifies when levels are near each other but does not know if those levels are actually significant to other traders.
Technical limitations to be aware of:
On chart timeframes larger than 15 minutes, the ORB calculation becomes less precise because you have fewer bars in the opening period. This indicator works best on 1 to 15 minute charts.
The overnight high and low tracking works best on futures. Stocks do not have true overnight sessions in the same way.
If your chart does not have volume data, the volume filter will not function properly.
Risk Management
This section is not about the indicator. It is about trading.
No indicator, no matter how well designed, can protect you from poor risk management. Before you trade any ORB breakout, you need to define your risk.
Where is your stop? A common approach is to place the stop on the opposite side of the ORB zone. If you are taking a bullish breakout above the high, your stop goes below the low. This means your risk is the full ORB range plus any slippage.
Is that risk acceptable? If the ORB range is 100 points and you are trading a 50 dollar per point contract, your risk is 5000 dollars plus commissions. Can you afford that loss? If not, either reduce your size or skip the trade.
Where is your target? The extensions provide potential targets, but you need to decide in advance where you will take profits. Hoping for an unlimited run while watching your profits evaporate is not a strategy.
What is your win rate? ORB breakouts do not work every time. Depending on the market and conditions, you might win 50 to 60 percent of the time. That means you will have losing trades. Are you prepared for a string of three or four losers in a row? It will happen.
None of this is specific to this indicator. It applies to all trading. But I include it here because I see too many traders focus on the indicator while ignoring the fundamentals of risk management. The indicator can help you identify setups. It cannot manage your risk for you.
Final Thoughts
I built this indicator for my own trading, then refined it to the point where I felt comfortable sharing it. It is not a holy grail. It will not make you profitable if you do not already have a trading process. What it will do is give you clean, accurate ORB levels with context that most indicators do not provide.
The Opening Range Breakout works because institutions and algorithms reference these same levels. When the first 30 or 60 minutes of trading establishes a range, that becomes a reference point for the rest of the session. This indicator makes those levels visible and adds intelligence around when they are worth paying attention to.
Use it as a tool, not a crutch. Combine it with your own analysis. Manage your risk properly. And please, do not trade with money you cannot afford to lose.
If you have questions or feedback, I am actively maintaining this indicator and will consider feature requests for future updates.
Trade well.
Tags
ORB, Opening Range Breakout, Intraday, Day Trading, Futures, Stocks, Multi-Timeframe, Breakout, Support Resistance, Session, NQ, ES, SPY, QQQ, Opening Range, Institutional Levels
Recommended Timeframes
This indicator works best on 1-minute, 2-minute, 3-minute, 5-minute, 10-minute, and 15-minute charts. It can be used on higher timeframes, but the ORB calculation becomes less precise.
Recommended Markets
US Stock Indices and Futures including ES, NQ, YM, RTY, SPY, QQQ, DIA, IWM. Individual stocks with sufficient liquidity. Forex major pairs. Cryptocurrency with defined trading sessions.

ICT Smart Money Trading Suite PRO [SwissAlgo]ICT SMC Trading Suite Pro
Structure Detection. Imbalance Tracking. Trade Planning. Contextual Alerts.
Why This Integrated System Was Built
The ICT/SMC methodology requires tracking multiple analytical components simultaneously - a process prone to manual errors, time inefficiency, and visual clutter . This indicator consolidates these elements into a single, unified system , providing rules-based validation for experienced ICT traders who may struggle with execution speed, consistency, and manual calculations.
-----------------------------------------------------------------
What This Indicator Does
ICT/SMC methodology involves tracking multiple analytical components simultaneously. This indicator consolidates them into a single system.
Common challenges when applying ICT manually:
1️⃣ Structure Identification
Determining which pivots qualify as external (macro) structure versus internal (micro) structure requires consistent rules. Inconsistent structure identification affects the detection of the relevant trading range for entries , Change of Character (ChoCH) , and Break of Structure (BoS) . Accurate structure identification is paramount ; a faulty reading invalidates the entire ICT thesis for the current swing. While no automated system can replace human judgment, the indicator provides you with a rules-based starting point for structural analysis. The key goal is to help you find and map the relevant structural leg to focus on.
2️⃣ Chart Organization
Drawing Fibonacci retracements, Fair Value Gaps, Order Blocks, and other imbalances manually creates visual complexity that can obscure the analysis. The indicator addresses this by striving to show all imbalances in a consistent, unified, and understandable visual way , using color coding and z-order layering to maintain clarity even when multiple components are active.
3️⃣ Imbalance Tracking
ICT methodology requires monitoring a vast array of institutional footprints : Fair Value Gaps (FVG), Order Blocks (OB), Breaker Blocks (BB), Liquidity Pools (LP), Volume Imbalances, Wick Imbalances, and Kill Zone ranges. Tracking all these simultaneously and manually monitoring their mitigation status is highly time-intensive and prone to oversight . The indicator constantly scans and tracks all key imbalance types for you, automatically updating their status and creating a dynamic, real-time visual heatmap of unmitigated institutional inefficiency.
4️⃣ Trade Calculation
Determining structure-based Stop Loss (SL) placement, calculating multiple Take Profit (TP) levels with accurate position-sizing splits, and computing the final blended Risk-to-Reward (R:R) ratio involves multiple time-sensitive, manual calculations per setup . The indicator automates this entire trade calculation process for you, instantly providing the necessary pricing (entry, SL, TP), sizing, and performance projections, and mitigating the risk of execution error .
5️⃣ Condition Monitoring
ICT setups often require specific technical conditions to align: price reaching discount Fibonacci levels (0.618-0.882 for shorts, 0.118-0.382 for longs), EMA crossovers confirming momentum, or structural shifts (ChoCH/BoS). Identifying these moments requires continuous chart observation across multiple assets and timeframes.
This indicator includes an alert system that monitors these technical conditions and sends notifications when they occur (real-time). The alert system is designed to minimize spam. This allows traders to review potential setups on demand rather than through continuous observation - particularly relevant for those monitoring multiple instruments or trading sessions outside their local timezone.
-----------------------------------------------------------------
Intended Use
This indicator is designed for traders who:
♦ Apply ICT/SMC methodology - Familiarity with concepts such as Fair Value Gaps, Order Blocks, Liquidity Pools, market structure, and discount/premium zones is assumed. The indicator does not teach these concepts but provides tools to apply them.
♦ Trade on intraday to swing timeframes - The structure detection and Fibonacci zone mapping work across multiple timeframes. Recommended primary timeframe: 1H (adjustable based on trading approach).
♦ Prefer systematic entry planning - The trade calculation feature computes stop loss, take profit levels, and risk-to-reward ratios based on structure and Fibonacci positioning. Suitable for traders who use defined entry criteria.
♦ Monitor multiple instruments or sessions - The alert functionality notifies when specific technical conditions occur (discount zone entries, EMA crossovers, structure changes), reducing the need for continuous manual monitoring.
♦ Use trade execution platforms - The trade summary table displays pre-formatted values (entry, SL, TP levels with quantity splits) that can be manually input into trading platforms or bot services like 3Commas.
-----------------------------------------------------------------
How To Use
Step 1: Structure Analysis
The indicator automatically detects external and internal market structure using pivot analysis. Structure lines are color-coded: red for bearish structure, green for bullish. External pivots are marked with larger triangles, internal pivots with smaller markers. The pivot length parameters (default: 20/20) can be adjusted in settings to align with your structural analysis approach and the asset you are analyzing.
Step 2: Define Your Trading Zone
Use the "Start Swing" and "End Swing" date inputs to mark the beginning and end of the (external) structural leg you wish to analyze. The indicator calculates Fibonacci retracement levels based on these points and color-codes the zones:
* Green zones: Discount area (0.618-0.882 for bearish / 0.118-0.382 for bullish)
* Yellow zones: Premium area (0.786-1.0 for bearish / 0.0-0.214 for bullish)
* Red zones: Extension area beyond structure (potential fake-out zones)
Step 3: Review Imbalances
The indicator identifies and displays multiple imbalance types:
🔥 Volume imbalances (from displacement candles based on PVSRA methodology)
🔥 Fair Value Gaps (FVG)
🔥 Order Blocks (OB) and Breaker Blocks (BB)
🔥 Liquidity Pools (LP) at equal highs/lows
🔥 Wick imbalances (exceptional wick formations)
🔥 Kill Zone liquidity from specific trading sessions (Asian, London, NY AM)
Volume Imbalances
Fair Value Gaps
Order Blocks
Liquidity Pools
Wick Imbalances
Kill Zone Imbalances
According to ICT methodology, imbalances act as price magnets - areas where price tends to return for mitigation. When multiple imbalances overlap at the same price level, this creates a confluence zone with a higher probability of price reaction .
Imbalances are displayed as gray boxes , creating a visual heatmap of institutional inefficiencies. When imbalances overlap, the zones appear darker due to layering, and labels combine to show confluence (e.g., "FVG + OB" or "Vol + LP").
Heatmap of Imbalances
User can view each type alone, or all together (heatmap)
Each imbalance type is tracked until mitigated by price according to ICT principles and can be toggled on/off independently in settings.
Step 4: Reference Levels & Sessions
The indicator displays additional reference data:
🔥 Daily Pivot Points (PP, R1-R3, S1-S3) calculated from previous day
🔥Average Daily Range (ADR) projected from the current day's extremes
🔥 Daily OHLC levels: Today's Open (DO), Previous Day High (PDH), Previous Day Low (PDL)
🔥Session backgrounds (optional): Color-coded boxes for Asian, London, NY AM, and NY PM sessions
Sessions
While these are not ICT-specific imbalances, they represent widely-watched price levels that often attract institutional activity and can act as additional reference points for support, resistance, and liquidity targeting.
All reference levels can be toggled independently in settings.
Step 5: Momentum Reference
EMA 14 and EMA 21 lines are displayed for momentum analysis. When EMA 14 enters discount zones and crosses EMA 21, a triangle marker appears on the chart. This indicates a potential alignment of structure and momentum conditions.
Step 6: Trade Planning
Input your intended entry price in the "Entry Price" field along with your margin and leverage parameters. The indicator automatically calculates all trade parameters:
* Stop loss level (based on Fibonacci structure - typically at 1.118 extension)
* Three take profit levels (TP1, TP2, TP3) with position quantity splits
* Risk-to-reward ratio (blended across all three targets)
* Projected profit/loss values in both dollars and percentage
All calculated values are displayed both visually on the chart (as horizontal lines with labels) and in a formatted Trade Summary table. The table organizes the information for quick reference: entry details, take profit levels with quantities, stop loss parameters, and performance projections.
This pre-calculated data can be manually copied into trading platforms or bot services (such as 3Commas Smart Trades) without requiring additional calculations.
Step 7: Alert Configuration
Create alerts using TradingView's alert system (select "Any alert() function call"). The indicator sends notifications when:
* Price reaches specific discount Fibonacci levels (0.618, 0.786, 0.882 for shorts / 0.382, 0.214, 0.118 for longs)
* EMA 14/21 crossovers occur within discount zones
* Change of Character (ChoCH) is detected
* Break of Structure (BoS) is detected
Note: Alerts require active TradingView alert functionality. Update alerts when changing your trading zone parameters.
-----------------------------------------------------------------
Key Features
Structure & Zone Analysis
* Automated structure detection with external/internal pivots and zig-zag visualization
* Fibonacci retracement mapping with color-coded discount/premium zones
* Visual zone classification: Green (optimal discount), Yellow (premium), Red (fake-out risk)
ICT Imbalances Heatmap
* Volume imbalances (PVSRA displacement candles)
* Fair Value Gaps (FVG)
* Order Blocks (OB) and Breaker Blocks (BB)
* Liquidity Pools (LP) at equal highs/lows
* Wick imbalances (exceptional wick formations)
* Kill Zone liquidity (Asian, London, NY AM sessions)
* Confluence detection with combined labels and visual layering
Reference Levels
* Daily Pivot Points (PP, R1-R3, S1-S3)
* Average Daily Range (ADR) projections
* Daily OHLC levels (DO, PDH, PDL)
* Session backgrounds for kill zones
Trade Planning Tools
* Automated stop loss calculation based on Fibonacci structure
* Three-tier take profit system with position quantity splits
* Risk-to-reward ratio calculation (blended across all targets)
* P&L projections in dollars and percentages
* Trade Summary table formatted for manual platform entry
Momentum & Signals
* EMA 14/21 overlay for momentum analysis
* Visual crossover markers (triangles) in discount zones
* Change of Character (ChoCH) detection and labels
* Break of Structure (BoS) detection and labels
Chart Enhancements
* Higher timeframe candle overlay (5m to Monthly)
* PVSRA candle coloring (volume-based)
* Symbol legend for quick reference
* Customizable visual elements (toggle all components independently)
Alert System
* Discount zone entry notifications (Fibonacci level monitoring)
* EMA crossover signals within discount zones
* Structure change alerts (ChoCH and BoS)
* Configurable via TradingView alert functionality
Alert Functionality
The indicator includes an alert system that monitors technical conditions continuously.
When configured, alerts notify users when specific events occur:
❗ Discount Zone Monitoring
When EMA 14 crosses into key Fibonacci levels (0.618, 0.786, 0.882 for bearish structure / 0.382, 0.214, 0.118 for bullish structure), an alert is triggered. Example: Trading BTC and ETH simultaneously - instead of monitoring both charts for zone entries, alerts notify when either asset reaches the specified level.
❗ Momentum Alignment
When EMA 14 crosses EMA 21 within discount zones, an alert is sent. Example: Monitoring setups across multiple timeframes (1H, 4H, Daily) - alerts indicate when momentum conditions align on any timeframe being tracked.
❗ Structure Changes
Change of Character (ChoCH) and Break of Structure (BoS) events trigger alerts. Example: Trading during the Asian session while located in a different timezone - alerts notify of structure changes occurring outside active monitoring hours.
Configuration
Alerts are set up through TradingView's native alert system. Select "Any alert() function call" when creating the alert.
⚠️ Note: Alert parameters are captured at creation time, so alerts must be updated when changing trading zone settings (Start/End Swing dates) or any other parameter.
How to Create Alerts
Step 1: Open Alert Creation
Click the "Alert" button (clock icon) in the top toolbar of TradingView, or right-click on the chart and select "Add Alert."
Step 2: Configure Alert Condition
* In the alert dialog, set the Condition dropdown to select this indicator
* Set the alert type to ⚠️ " Any alert() function call "
* This configuration allows the indicator to trigger alerts based on its internal logic
Step 3: Set Alert Timing
* Timeframe: Same as chart
* Expiration: Choose "Open-ended (when triggered)" to keep the alert active until conditions occur
* Message tab: choose a name for the alert
Step 4: Notification Settings
Configure how you want to receive notifications:
* Popup within TradingView
* Email notification
* Mobile app push notification (requires TradingView mobile app)
Step 5: Create
Important Notes:
* Alert parameters are captured at creation time . If you change your trading zone (Start/End Swing dates) or entry price, delete the old alert and create a new one .
* One alert per chart: Create separate alerts for each instrument and timeframe you're monitoring.
* TradingView alert limits apply based on your TradingView subscription tier.
What Triggers Alerts: This indicator sends alerts for four key event types:
1. Discount Zone Entry - EMA 14 crossing key Fibonacci levels
2. Momentum Crossover - EMA 14/21 crossovers within discount zones
3. Change of Character (ChoCH) - Structure reversal detected
4. Break of Structure (BoS) - Trend continuation confirmed
All four conditions are monitored by a single alert configuration .
-----------------------------------------------------------------
Recommended Settings
* Timeframe : 1H works well for most assets
* Theme : Dark mode recommended
* Structural Pivots : Default 20/20 captures reasonable structure; adjust to match your analysis
-----------------------------------------------------------------
Chart Elements Guide
♦ Structure Visualization
Zig-zag lines
Automated structure detection - green lines indicate bullish structure, red lines indicate bearish structure. Thick lines represent external structure , thin faded lines show internal structure .
Triangle markers
Large triangles mark external pivots (swing highs/lows), small triangles mark internal pivots.
Fibonacci Zones
* Green zones: Discount area - potential entry zones (0.618-0.882 for shorts / 0.118-0.382 for longs)
* Yellow zones: Premium area - higher extension zones (0.786-1.0 for shorts / 0.0-0.214 for longs)
* Red zones: Fake-out risk area - price beyond structural extremes (above 1.0 for shorts / below 0.0 for longs)
* White dashed lines: Individual Fibonacci levels (1.0, 0.882, 0.786, 0.618, 0.5, 0.382, 0.214, 0.118, 0.0)
♦ Imbalance Heatmap
Gray boxes with dotted midlines
Unmitigated imbalances create a visual heatmap. Overlapping imbalances appear darker due to layering.
Combined labels
When multiple imbalances overlap, labels show confluence (e.g., "FVG + OB", "Vol + LP + Wick")
Types displayed : Vol (Volume), FVG (Fair Value Gap), OB (Order Block), BB (Breaker Block), LP (Liquidity Pool), Wick, KZ (Kill Zone)
♦ Momentum Indicators
* Red line: EMA 14
* Yellow line: EMA 21
* Small triangles on price: Crossover signals - red triangle (bearish crossover), green triangle (bullish crossover) when occurring within discount zones
♦ Structure Change Markers
* Labels with checkmarks/crosses: ChoCH (Change of Character) and BoS (Break of Structure) events (Green label with ✓: Bullish ChoCH or BoS, Red label with ✗: Bearish ChoCH or BoS)
♦ Trade Planning Lines (when entry price is set)
* Blue horizontal line: Entry price
* Green dashed lines: TP1 and TP2
* Green solid line: TP3 (final target)
* Red horizontal line: Stop Loss level
TP levels and SL are calculated based on the structure range, entry price, and mapped trading zone, and aim to achieve a minimum risk: reward ratio of 1:1.5 (R:R)
♦ Colored background zones:
Green shading between entry and TP3 (profit zone), red shading between entry and SL (loss zone)
♦ Reference Levels
* Orange dotted lines with labels: Daily Pivot Points (PP, R1-R3, S1-S3)
* Purple dotted lines with labels: ADR High and ADR Low projections
* Cyan dotted lines with labels: DO (Daily Open), PDH (Previous Day High), PDL (Previous Day Low)
♦ Session Backgrounds (optional)
* Yellow shaded box: Asian session (19:00-00:00 NY time)
* Blue shaded box: London session (02:00-05:00 NY time)
* Green shaded box: NY AM session (09:30-11:00 NY time)
* Orange shaded box: NY PM session (13:30-16:00 NY time)
♦ Trade Summary Table (top-right corner)
Displays a complete trade plan with sections:
* Sanity Check: Plan validation status
* Setup: Trade type, leverage, entry price, position size
* Take Profit: TP1, TP2, TP3 with prices, percentages, and quantity splits
* Stop Loss: SL price and type
* Performance: Potential profit/loss, ROI, and risk-to-reward ratio
♦ HTF Candle Overlay (optional, displayed to the right of the current price)
* Larger candlesticks representing higher timeframe price action
* Green bodies: Bullish HTF candles
* Red bodies: Bearish HTF candles
* Label shows selected timeframe (e.g., "HTF→ D" for daily)
♦ Legend Table (bottom-right corner)
Quick reference guide explaining all symbol abbreviations and color codes used on the chart.
-----------------------------------------------------------------
Methodology & Calculation Details
This indicator consolidates multiple ICT/SMC analytical components into a single integrated system. While individual elements could be created separately, this integration provides automated coordination between components , consistency, and reduces chart complexity.
Structure Detection External and internal pivots
Are identified using fractal pivot analysis with configurable lookback periods (default: 20 bars for both). A pivot high is confirmed when the high at the pivot bar exceeds all highs within the lookback range on both sides. Pivot lows use inverse logic. Structure lines connect validated pivots, with color coding based on price direction (higher highs/higher lows = bullish, lower highs/lower lows = bearish).
Fibonacci Retracement Calculation
Users define two swing points via date/time inputs. The indicator calculates the price range between these points and applies standard Fibonacci ratios (0.0, 0.118, 0.214, 0.382, 0.5, 0.618, 0.786, 0.882, 1.0, plus extensions at 1.118, 1.272, -0.118, -0.272). Zone classification is based on ICT discount/premium principles: 0.618-1.0 range for bearish setups, 0.0-0.382 for bullish setups.
Imbalance Identification
Volume Imbalances : Detected using PVSRA (Price, Volume, Support, Resistance Analysis) methodology. Candles are classified based on the percentile ranking of volume and price range over a 1344-bar lookback period. Type 1 imbalances require ≥95th percentile in both volume and range; Type 2 requires ≥85th percentile. Additional filters include body-to-range ratio (≥50% for Type 1, ≥30% for Type 2) and ATR validation.
Fair Value Gaps (FVG) : Identified when a three-candle sequence shows a price gap: low > high for bullish FVG, high < low for bearish FVG. The middle candle must close beyond the gap edge. Mitigation occurs when the price retraces into the gap.
Order Blocks (OB) : Detected by identifying the last opposing candle before a significant price move. When price breaks a swing high/low, the algorithm scans backwards to find the candle with the highest high (bearish OB) or lowest low (bullish OB) before the breakout. When an OB is breached, it converts to a Breaker Block (BB).
Liquidity Pools (LP) : Identified by detecting equal highs or equal lows using a tolerance threshold based on ATR. Pivot highs/lows within this tolerance range are grouped. Equal highs create Buy-Side Liquidity (BSL) zones above the level; equal lows create Sell-Side Liquidity (SSL) zones below the level.
Wick Imbalances: Flagged when a candle's wick exceeds 1.0x ATR and comprises >50% of the total candle range. These represent rapid rejections or absorption events.
Kill Zone Liquidity: Tracks the high/low range during specific ICT-defined sessions (Asian: 19:00-00:00 NY, London: 02:00-05:00 NY, NY AM: 09:30-11:00 NY). At session close, BSL and SSL zones are created above/below the session range.
Change of Character (ChoCH) & Break of Structure (BoS)
ChoCH is detected when price breaks counter to the established structure (bearish structure broken upward = bullish ChoCH; bullish structure broken downward = bearish ChoCH). BoS occurs when price breaks in the direction of the established trend (bearish structure breaking lower = bearish BoS; bullish structure breaking higher = bullish BoS).
Trade Calculations
Stop Loss and Take Profit levels are calculated based on the entry position within the Fibonacci zone structure:
* Premium entries (0.786-1.0 for shorts / 0.0-0.214 for longs): SL at 1.118/-0.118 extension, TP structure weighted toward zone extremes
* Golden entries (0.618-0.786 for shorts / 0.214-0.382 for longs): SL at 1.0/0.0 boundary, TP structure balanced across range
Risk-to-reward ratios are calculated as blended values across all three take profit levels, weighted by position quantity splits.
Reference Level Calculations
* Pivot Points: Standard formula using previous day's high, low, and close: PP = (H + L + C) / 3
* Support/Resistance: R1 = 2×PP - L, S1 = 2×PP - H, with R2/S2 and R3/S3 calculated using range extensions
* ADR: 14-period simple moving average of daily high-low range, projected from current day's extremes
Momentum Analysis
EMA 14 and EMA 21 use standard exponential moving average calculations. Crossovers are detected when EMA 14 crosses EMA 21 within user-defined discount zones, with directional confirmation (cross under in bearish discount = short signal; cross over in bullish discount = long signal).
Why This Integration Matters
While components like EMA crossovers, pivot detection, or Fibonacci retracements exist as separate indicators, this system provides:
1. Coordinated Analysis : All components reference the same structural framework (user-defined trading zone)
2. Automated Mitigation Tracking : Imbalances are monitored continuously and removed when mitigated according to ICT principles
3. Contextual Alerts : Notifications are triggered only when conditions align within the defined structural context
4. Trade Parameter Automation : Stop loss and take profit calculations adjust dynamically based on entry positioning within the structure
5. Consistent Visual Display : All elements use a unified color scheme, labeling system, and z-order layering. This eliminates visual conflicts that occur when stacking multiple independent indicators (overlapping lines, label collisions, inconsistent transparency levels, conflicting color schemes).
This consolidation reduces the need to manually coordinate 8-10 separate indicators, eliminates redundant calculations across disconnected tools, and maintains visual clarity even when all components are displayed simultaneously.
-----------------------------------------------------------------
Disclaimer
1. Indicator Functionality and Purpose
This indicator is solely a technical analysis tool built upon established methodologies (Smart Money Concepts/ICT) and statistical calculations (Pivots, Fibonacci, EMAs). It is designed to assist experienced traders in visualizing complex data, streamlining the analytical workflow, and automating conditional alerting.
The indicator is NOT:
♦ Financial Advice: It does not provide personalized investment recommendations, solicited advice, or instruction on buying, selling, or holding any financial instrument.
♦ A Guarantee of Profit: The presence of a signal, alert, or trade plan output by this tool does not guarantee that any trade will be profitable.
♦ A Predictor of Future Prices: The tool calculates probabilities and potential scenarios based on historical data and current structure; it does not predict future market movements.
2. General Trading Risks and Capital Loss
♦ All trading involves substantial risk of loss. You may lose some or all of your initial capital. Leveraged products, such as futures, CFDs, and margin trading, carry a high degree of risk and are not suitable for all investors.
♦ Risk Acknowledgment: By using this indicator, you acknowledge and accept that you are solely responsible for all trading decisions, and you bear the full risk of any resulting profit or loss.
♦ Risk Management is Crucial: This indicator is an analytical tool only. You must employ independent risk management techniques (position sizing, stop-loss orders) tailored to your personal financial situation and risk tolerance.
3. Calculation Limitations and Non-Real-Time Data
The calculations performed by this indicator are based on the data provided by your charting platform (e.g., TradingView).
♦ Data Accuracy: The accuracy of the outputs (e.g., Price Delivery Arrays, Pivots, P&L projections) is dependent on the accuracy and real-time nature of the underlying market data feed.
♦ Latencies: Trade alerts and signals may be subject to minor delays due to server processing, internet connectivity, or charting platform performance. Do not rely solely on alerts for execution.
♦ Backtesting and Performance: Any depiction of past performance, including data visible on the chart, is not indicative of future results. Trading results will vary based on market conditions, liquidity, and execution speed.
4. Software and Platform Disclaimer
"As Is" Basis: The indicator is provided on an "as is" basis without warranties of any kind, whether express or implied. The author does not guarantee the script will be error-free or operate without interruption.
Third-Party Integration: This indicator is not affiliated with, endorsed by, or connected to TradingView, 3Commas, or any other broker or execution platform. All third-party names are trademarks of their respective owners. The formatting of the Trade Summary Table for 3Commas is for user convenience only.
5. Required Competency (User Responsibility)
This indicator is built on the assumption that the user is an experienced trader with a working understanding of the complex concepts being visualized (ICT/SMC, FVG, Order Blocks, Liquidity, etc.). The indicator does not teach these concepts.
You Must Always Do Your Own Research (DYOR) before making any trading decision based on signals or visualization provided by this tool.
By installing and using this indicator, you explicitly agree to these terms and assume full responsibility for all trading activity.

[GetSparx] Nova Pro⚡ Nova Pro – Position Calculator
This indicator is a user-friendly TradingView indicator designed to help traders plan and visualize their entry and exit points, calculate position sizing, and instantly display key risk metrics. By simply entering three price levels (Entry, Take Profit and Stop Loss) along with a risk amount in USD, the indicator draws color-coded lines and labels on the chart, and generates a concise table with all computed values. This allows you to assess the risk-reward profile of any trade at a glance, without performing manual calculations.
⚙️ How It Works
When the indicator is added to the chart it will ask to specify the price inputs and the risk amount in USD.
Price Inputs (Entry, TP, SL)
• You specify three price levels: the entry price, the profit target (Take Profit) and the loss threshold (Stop Loss).
• Inputs use TradingView’s native price-picker fields. Any change is immediately reflected on the chart.
Visual Display
• Each level is plotted as a line stretching into the future for enough room.
• Labels on the right show the exact price, color-coded: orange for Entry, green for TP and red for SL.
• Previous lines and labels are automatically removed when parameters change, ensuring the chart remains clean.
Risk Calculations
• The entered risk amount (in USD) is combined with the distance between Entry and SL to compute the optimal number of units (Qty) to trade.
• The script automatically detects whether it’s a long or short trade based on the relative positions of Entry and TP.
• Note that the risk and reward calculations do not factor in exchange fees, slippage, funding rates or any other trading costs. Actual profit and loss may differ once transaction fees and market execution variances are applied, so be sure to adjust your position sizing and expectations accordingly.
🎯 What You Can Do With It
• Consistent Position Sizing
Automate your position size so you consistently risk the same dollar amount, regardless of price volatility or stop distance.
• Clear Risk Management
Instantly view your Reward-to-Risk ratio, potential profit in USD and exact risk amount, so you make well-informed decisions.
• Rapid Scenario Analysis
Adjust TP, SL or Entry on the fly to see how each change affects your potential profit, loss and RR ratio.
• Publication-Ready Charts
The visual elements and integrated table are optimized for TradingView publications, giving your analysis a professional, polished look.
📊 Explanation of Table Values
• Entry
Calculation: rounded to the nearest tick of your entered entry price.
Marks the exact level at which you initiate the trade and serves as the reference point for all further risk and reward calculations.
• Quantity (Qty)
Calculation: Risk USD ÷ (Entry − Stop Loss).
Determines how many units, contracts or shares to trade so that a stop-out at your SL equals exactly your predefined dollar risk, resulting in consistent per-trade exposure.
• Risk to Reward (RR)
Calculation: (Take Profit − Entry) ÷ (Entry − Stop Loss).
Expresses how many dollars of potential profit you target for each dollar you risk. Values above 1 mean the reward exceeds the risk, guiding you to favorable setups.
• Take Profit (TP)
Calculation: rounded to the nearest tick of your entered take-profit price.
Your target exit level for booking gains, highlighted in green on the chart. Shows where you plan to capture profits if the market moves in your favor.
• Profit
Calculation: Qty × (Take Profit − Entry).
Gives the absolute potential gain in USD if price reaches your TP. Useful for comparing total return across different instruments or setups.
• Stop Loss (SL)
Calculation: rounded to the nearest tick of your entered stop-loss price.
The level at which your trade is automatically closed to cap losses, highlighted in red on the chart. Ensures you never lose more than your defined risk amount.
• Risk
Calculation: equals the entered Risk USD.
The maximum dollar amount you’re willing to lose on this trade. Acts as the upper boundary for your exposure, keeping your position sizing disciplined.
📝 Examples
• Long Example 1: Bitcoin/USD
Entry: $11851.1
Take Profit: $123853.9
Stop Loss: $115467.7
Risk USD: $500
The Risk to Reward ratio results in 2.25, which means the reward exceeds the risk.
For each dollar you risk, this setup has potential gains of 2.25 dollars.
• Long Example 2: Algorand/USD
Entry: $0.2919
Take Profit: $0.3491
Stop Loss: $0.2655
Risk USD: $1000
The Risk to Reward ratio on this trade results in 2.17 and has a potential profit target of $2166.67. With a risk of $1000 USD the table conveniently shows a quantity of 37878 ALGO is needed for the trade.
• Short Example 1: Forex EUR/USD
Entry: $1.16666
Take Profit: $1.15459
Stop Loss: $1.17374
Risk USD: $200
With a risk of $200 USD and a RR of 2.17, this example shows how a short trade can be accomplished on EUR/USD.
• Short Example 2: Gold
Entry: $3366.29
Take Profit: $3272.01
Stop Loss: $3386.87
Risk USD: $1500
Within this short setup a risk of $1500 USD is used, which results in a RR of 4.58. The potential profit for this trade is $6871.72.
⚠ Disclaimer
This tool is for educational and analytical use only. It does not provide financial advice or trading signals. Always use proper risk management and do your own due diligence.

Pressure Pivots - MPIPressure Pivots - MPI
A multi-factor reversal detection system built on a proprietary Market Pressure Index (MPI) that combines institutional order flow analysis, liquidity dynamics, and momentum exhaustion to identify high-probability pivot points with automated win rate validation.
What This System Does
This indicator solves the core challenge of reversal trading: distinguishing genuine exhaustion pivots from temporary retracements. It combines six independent detection mechanisms—divergence, liquidity sweeps, order flow imbalance, wick rejection, volume surges, and velocity exhaustion—weighted by reliability and unified through a custom pressure oscillator.
Three-Layer Architecture:
Layer 1 - Market Pressure Index (MPI): Proprietary volume-weighted pressure oscillator that measures buying vs. selling pressure using proportional intrabar allocation and dual-timeframe normalization (-1.0 to +1.0 range).
Layer 2 - Weighted Confluence Engine: Six detection factors scored hierarchically (divergence: 3.0 pts, liquidity: 2.5 pts, order flow: 2.0 pts, velocity: 1.5 pts, wick: 1.5 pts, volume: 1.0 pt). Premium signals (DIV/LIQ/OF) require 6.0+ score, standard signals (STD) require 4.0+ score.
Layer 3 - Automated Win Rate Validation: Every signal tracked forward and validated against actual pivot formation within 10-bar window. Real-time performance statistics displayed by signal type and direction.
The Market Pressure Index - Original Calculation
What MPI Measures: The balance of aggressive buying vs. aggressive selling within each bar, smoothed and normalized to create a continuous oscillator.
Calculation Methodology:
Step 1: Intrabar Pressure Decomposition
Buy Pressure = Volume × (Close - Low) / (High - Low)
Sell Pressure = Volume × (High - Close) / (High - Low)
Net Pressure = Buy Pressure - Sell Pressure
Step 2: Exponential Smoothing
Smooth Pressure = EMA(Net Pressure, 14)
Step 3: Normalization
Avg Absolute Pressure = SMA(|Net Pressure|, 28)
MPI Raw = Smooth Pressure / Avg Absolute Pressure
Step 4: Sensitivity Amplification
MPI = clamp(MPI Raw × 1.5, -1.0, +1.0)
Why This Is Different:
• vs. RSI: RSI measures price momentum without volume context. MPI integrates volume magnitude and distribution within each bar.
• vs. OBV: OBV uses binary classification (up bar = buy volume). MPI uses proportional allocation based on close position within range.
• vs. Money Flow Index: MFI uses typical price × volume. MPI uses intrabar positioning, revealing pressure balance regardless of bar-to-bar movement.
• vs. VWAP: VWAP shows average price. MPI shows directional pressure balance (who controls the bar).
MPI Interpretation:
• +0.7 to +1.0: Extreme buying pressure (strong uptrends, potential exhaustion)
• +0.3 to +0.7: Moderate buying pressure (healthy uptrends)
• -0.3 to +0.3: Neutral/balanced (ranging, consolidation)
• -0.7 to -0.3: Moderate selling pressure (healthy downtrends)
• -1.0 to -0.7: Extreme selling pressure (strong downtrends, potential exhaustion)
Critical Insight: MPI at extremes indicates pressure exhaustion risk , not automatic reversal. Reversals occur when extreme MPI coincides with confluence factors.
Six Confluence Factors - Detection Arsenal
1. Divergence Detection (Weight: 3.0 - Highest Priority)
Detects: Price making higher highs while MPI makes lower highs (bearish), or price making lower lows while MPI makes higher lows (bullish).
Why It Matters: Reveals weakening pressure behind price moves. Declining participation signals potential reversal.
Signal Type: Premium (DIV) - Historically highest win rates.
2. Liquidity Sweep Detection (Weight: 2.5)
Detects: Price penetrates recent swing high/low (triggering stops), then immediately reverses and closes back inside range.
Calculation: High breaks swing high by <0.3× ATR but closes below it (bearish), or low breaks swing low by <0.3× ATR but closes above it (bullish).
Why It Matters: Stop hunts mark institutional accumulation/distribution zones. Often pinpoints exact pivot points.
Signal Type: Premium (LIQ) - Extremely reliable with volume confirmation.
3. Order Flow Imbalance (Weight: 2.0)
Detects: Aggressive directional ordering where price consistently closes in upper/lower third of bars with elevated volume.
Calculation:
Close Position = (Close - Low) / (High - Low)
Aggressive Buy = Volume when Close Position > 0.65
Aggressive Sell = Volume when Close Position < 0.35
Imbalance = EMA(Aggressive Buy, 5) - EMA(Aggressive Sell, 5)
Strong Flow = |Imbalance| > 1.5 × Average
Why It Matters: Reveals institutional accumulation/distribution footprints before directional moves.
Signal Type: Premium (OF)
4. Wick Rejection Patterns (Weight: 1.5)
Detects: Pin bars, hammers, shooting stars where wick exceeds 60% of total bar range.
Why It Matters: Large wicks demonstrate failed attempts to push price, indicating strong opposition.
5. Volume Spike Detection (Weight: 1.0)
Detects: Volume exceeding 2× the 20-bar average.
Why It Matters: Confirms institutional participation vs. retail noise. Most effective when combined with wick rejection or liquidity sweeps.
6. Velocity Exhaustion (Weight: 1.5)
Detects: Parabolic moves (velocity >2.0× ATR over 3 bars) showing deceleration while MPI at extremes.
Calculation:
Velocity = Change(Close, 3) / ATR(14)
Exhaustion = |Velocity| > 2.0 AND MPI > |0.5| AND Velocity Slowing
Why It Matters: Extended moves are unsustainable. Momentum deceleration from extremes precedes reversals.
Signal Classification & Scoring
Weighted Confluence Scoring:
Each factor contributes points when present. Signals fire when total score exceeds thresholds:
Bearish Example:
+ At recent high (1.0)
+ Bearish divergence (3.0)
+ Wick rejection (1.5)
+ Volume spike (1.0)
+ Velocity slowing (1.5)
= 8.0 total score → BEARISH DIV SIGNAL
Bullish Example:
+ At recent low (1.0)
+ Liquidity sweep (2.5)
+ Strong buy flow (2.0)
+ Wick rejection (1.5)
= 7.0 total score → BULLISH LIQ SIGNAL
Dual Threshold System:
• Premium Signals (DIV/LIQ/OF): Require 6.0+ points. Must include divergence, liquidity sweep, or order flow. Higher win rates.
• Standard Signals (STD): Require 4.0+ points. No premium factors. More frequent, moderate win rates.
Visual Signal Color-Coding:
• Purple Triangle: DIV (Divergence signal)
• Orange Triangle: LIQ (Liquidity sweep signal)
• Aqua Triangle: OF (Order flow signal)
• Red/Green Triangle: STD (Standard signal)
• Yellow Diamond: Warning (setup forming, not confirmed)
Warning System - Early Alerts
Yellow diamond warnings fire when 2+ factors present but full confluence not met:
• At recent 10-bar high/low
• Wick rejection present
• Volume spike present
• MPI extreme or accelerating/decelerating
Critical: Warnings are NOT trade signals. They indicate potential setups forming. Wait for colored triangle confirmation.
Win Rate Validation - Transparent Performance Tracking
How It Works:
Signal Storage: Every signal recorded (bar index, price, type, direction)
Pivot Confirmation: System monitors next 10 bars for confirmed pivot formation at signal price (±2%)
Validation: If pivot forms within window → Win. If not → Loss.
Statistics: Win Rate = Validated Signals / Total Mature Signals × 100
Dashboard Displays:
• Overall win rate with visual bar
• Bearish signal win rate
• Bullish signal win rate
• Win rate by signal type (DIV/LIQ/OF/STD)
• Wins/Total for each category
Why This Matters:
After 30-50 signals, you'll know exactly which patterns work on your instrument:
Example Performance Analysis:
Overall: 58% (35/60)
Bearish: 52% | Bullish: 65%
DIV: 72% | LIQ: 68% | OF: 50% | STD: 38%
Insight: Focus on bullish DIV/LIQ signals (72%/68% win rate), avoid STD signals (38%), investigate bearish underperformance.
This transforms the indicator from signal generator to learning system.
Dynamic Microstructure Visualization
Fibonacci Retracement Levels
• Auto-detects last swing high + swing low
• Draws 11 levels: 0%, 23.6%, 38.2%, 50%, 61.8%, 78.6%, 100%, 127.2%, 161.8%, 200%, 261.8%
• Removes crossed levels automatically
• Clears on new signal (fresh structure analysis)
• Color gradient (bullish to bearish across range)
• Key levels (0.618, 0.5, 1.0) highlighted with solid lines
Support/Resistance Lines
• Resistance: 50-bar highest high (red, only shown when above price)
• Support: 50-bar lowest low (green, only shown when below price)
• Auto-removes when price crosses
Usage: Signals firing at key Fibonacci levels (38.2%, 50%, 61.8%) or major S/R zones have enhanced structural significance.
Dashboard - Real-Time Intelligence
MPI Status:
• Current pressure reading with interpretation
• Color-coded background (green/red/gray zones)
Signal Status:
• Active signal type and direction
• Confidence score with visual bar (20 blocks, color-coded)
• Scanning status when no signal active
Divergence Indicator:
• Highlights active divergence separately (highest priority factor)
Performance Stats:
• Overall win rate with 10-block visual bar
• Directional breakdown (bearish vs. bullish)
• Signal type breakdown (DIV/LIQ/OF/STD individual win rates)
• Sample size for each category
Customization:
• Position: 9 locations (Top/Middle/Bottom × Left/Center/Right)
• Size: Tiny/Small/Normal/Large
• Toggle sections independently
How to Use This System
Initial Setup (10 Minutes)
1. MPI Configuration:
• Period: 14 (balanced) | 5-10 for scalping | 21-30 for swing
• Sensitivity: 1.5 (moderate) | Increase if MPI rarely hits ±0.7 | Decrease if constantly maxed
2. Detection Thresholds:
• Wick Threshold: 0.6 (60% of bar must be wick)
• Volume Spike: 2.0× average (lower to 1.5-1.8 for stocks, raise to 2.5-3.0 for crypto)
• Velocity: 2.0 ATR (raise to 2.5-3.0 for crypto)
3. Confluence Settings:
• Enable Divergence (highest win rate factor)
• Pivot Lookback: 5 (day trading) | 8-10 (swing trading)
• Keep default weights initially
4. Thresholds:
• Premium: 6.0 (quality over quantity)
• Standard: 4.0 (balanced)
• Warning: 2 factors minimum
Trading Workflow
When Warning Fires (Yellow Diamond):
Note warning type (bearish/bullish)
Do not enter - this is preparation only
Monitor for full signal confirmation
Prepare entry parameters
When Signal Fires (Colored Triangle):
Identify type from color (Purple=DIV, Orange=LIQ, Aqua=OF, Red/Green=STD)
Check dashboard confidence score
Verify confluence on chart (wick, volume, MPI extreme, Fib level)
Confirm with your analysis (context, higher timeframe, news)
Enter with proper risk management
Risk Management (Not Provided by Indicator):
• Stop Loss: Beyond recent swing or 1.5-2.0× ATR
• Position Size: Risk 0.5-2% of capital per trade
• Take Profit: 2-3× ATR or next structural level
Performance Analysis (After 30-50 Signals)
Review Dashboard Statistics:
Overall Win Rate:
• Target >50% for profitability with 1:1.5+ RR
• <45% = system may not suit instrument
• >65% = consider tightening thresholds
Directional Analysis:
• Bullish >> Bearish = uptrend bias, avoid counter-trend shorts
• Bearish >> Bullish = downtrend bias, avoid counter-trend longs
Signal Type Ranking:
• Focus on highest win rate types (typically DIV/LIQ)
• If STD <40% = raise threshold or ignore STD signals
• If premium type <50% = investigate (may need parameter adjustment)
Optimize Settings:
• Too many weak signals → Raise thresholds (premium 7.0-8.0, standard 5.0-6.0)
• Too few signals → Lower thresholds or reduce detection strictness
• Adjust factor weights based on what appears in winning signals
What Makes This Original
1. Proprietary Market Pressure Index
Unique Methodology:
• Proportional intrabar allocation: Unlike binary volume classification (OBV), MPI uses close position within range for proportional pressure assignment
• Dual-timeframe normalization: EMA smoothing (14) + SMA normalization (28) for responsiveness with context
• Bounded oscillator with sensitivity control: -1 to +1 range enables cross-instrument comparison while sensitivity allows customization
• Active signal integration: MPI drives divergence detection, extreme requirements, exhaustion confirmation (not just display)
vs. Existing Indicators:
• MFI uses typical price × volume (different pressure measure)
• CMF accumulates over time (not bounded oscillator)
• OBV is cumulative and binary (not proportional or normalized)
2. Hierarchical Confluence Engine
Why Simple Mashups Fail: Most multi-indicator systems create decision paralysis (RSI says sell, MACD says buy).
This System's Solution:
• Six factors weighted by reliability (3.0 down to 1.0)
• Dual thresholds (premium 6.0, standard 4.0)
• Automatic signal triage by quality tier
• Color-coded visual prioritization
Orthogonal Detection: Each factor detects different failure mode:
• Divergence = momentum exhaustion
• Liquidity = institutional manipulation
• Order Flow = smart money positioning
• Wick = supply/demand rejection
• Volume = participation confirmation
• Velocity = parabolic exhaustion
Complementary, not redundant. Weighted synthesis creates unified confidence measure.
3. Self-Validating Performance System
The Problem: Most indicators never reveal actual performance. Traders never know if it works on their instrument.
This Solution:
• Forward-looking validation (signals tracked to pivot confirmation)
• Pivot-based success criteria (objective, mechanical)
• Segmented statistics (by direction and type)
• Real-time dashboard updates
Result: After 30-50 signals, you have statistically meaningful data on what actually works on your specific market. Transforms indicator into adaptive learning system.
Technical Notes
No Repainting:
• All signals use confirmed bar data (closed bars only)
• Pivot detection has inherent lookback lag (5 bars)
• Divergence lines drawn after confirmation (retroactive visualization)
• Signals fire on bar close
Forward-Looking Disclosure:
• Win rate validation looks forward 10 bars for pivot confirmation
• Creates forward bias in statistics , not signal generation
• Real-time performance may differ until validation period elapses
Lookback Limits:
• Fibonacci/S/R: Limited by limitDrawBars (default 100)
• MPI calculation: 28 bars maximum
• Signal storage: 20 per direction (configurable)
Visual Limits:
• Max lines/labels/boxes: 500 each
• Auto-clearing prevents overflow
Limitations & Disclaimers
Not a Complete Trading System:
• Does not provide stop loss, take profit, or position sizing
• Requires trader risk management and market context analysis
Reversal Bias:
• Designed specifically for reversal trading
• Not optimized for trend continuation or breakouts
Learning Period:
• Statistics meaningless until 20-30 mature signals
• Preferably 50+ for statistical confidence
Instrument Dependency:
• Best: Liquid instruments (major forex, large-caps, BTC/ETH)
• Poor: Illiquid small-caps, low-volume altcoins (order flow unreliable)
Timeframe Dependency:
• Optimal: 15m - 4H charts
• Not Recommended: <5m (noise) or >Daily (insufficient signals)
No Guarantee of Profit:
• Win rate >50% does not guarantee profitability (depends on RR, sizing, execution)
• Past performance ≠ future performance
• All trading involves risk of loss
Warning Signals:
• Warnings are NOT trade signals
• Trading warnings produces lower win rates
• For preparation only
Recommended Settings by Instrument
Forex Majors (15m-1H):
• MPI Sensitivity: 1.3-1.5 | Volume: 2.0 | Thresholds: 6.0/4.0
Crypto BTC/ETH (15m-4H):
• MPI Sensitivity: 2.0-2.5 | Volume: 2.5-3.0 | Velocity: 2.5-3.0 | Thresholds: 6.5-7.0/4.5-5.0
Large-Cap Stocks (5m-1H):
• MPI Sensitivity: 1.2-1.5 | Volume: 1.8-2.0 | Thresholds: 6.0/4.0
Index Futures ES/NQ (5m-30m):
• MPI Period: 10-14 | Sensitivity: 1.5 | Velocity: 1.8-2.0 | Thresholds: 5.5-6.0/4.0
Altcoins High Vol (1H-4H):
• MPI Period: 21 | Sensitivity: 2.0-3.0 | Volume: 3.0+ | Thresholds: 7.0-8.0/5.0 (very selective)
Alert Configuration
Built-In Alerts:
Bullish Signal (all types)
Bearish Signal (all types)
Bullish Divergence (DIV only)
Bearish Divergence (DIV only)
Setup:
• TradingView Alert → Select "Pressure Pivots - MPI"
• Choose condition
• Frequency: "Once Per Bar Close" (prevents repainting)
• Configure notifications (popup/email/SMS/webhook)
Recommended:
• Active traders: Enable all signals
• Selective traders: DIV only (highest quality)
In-Code Documentation
Every input parameter includes extensive tooltips (800+ words total) providing:
• What it controls
• How it affects calculations
• Range guidance (low/medium/high implications)
• Default justification
• Asset-specific recommendations
• Timeframe adjustments
Access: Hover over (i) icon next to any setting. Creates self-documenting learning system—no external docs required.
DskyzInvestments | Trade with insight. Trade with anticipation.

Risk & Position DashboardRisk & Position Dashboard
Overview
The Risk & Position Dashboard is a comprehensive trading tool designed to help traders calculate optimal position sizes, manage risk, and visualize potential profit/loss scenarios before entering trades. This indicator provides real-time calculations for position sizing based on account size, risk percentage, and stop-loss levels, while displaying multiple take-profit targets with customizable risk-reward ratios.
Key Features
Position Sizing & Risk Management:
Automatic position size calculation based on account size and risk percentage
Support for leveraged trading with maximum leverage limits
Fractional shares support for brokers that allow partial share trading
Real-time fee calculation including entry, stop-loss, and take-profit fees
Break-even price calculation including trading fees
Multi-Target Profit Management:
Support for up to 3 take-profit levels with individual portion allocations
Customizable risk-reward ratios for each take-profit target
Visual profit/loss zones displayed as colored boxes on the chart
Individual profit calculations for each take-profit level
Visual Dashboard:
Clean, customizable table display showing all key metrics
Configurable label positioning and styling options
Real-time tracking of whether stop-loss or take-profit levels have been reached
Color-coded visual zones for easy identification of risk and reward areas
Advanced Configuration:
Comprehensive input validation and error handling
Support for different chart timeframes and symbols
Customizable colors, fonts, and display options
Hide/show individual data fields for personalized dashboard views
How to Use
Set Account Parameters: Configure your account size, maximum risk percentage per trade, and trading fees in the "Account Settings" section.
Define Trade Setup: Use the "Entry" time picker to select your entry point on the chart, then input your entry price and stop-loss level.
Configure Take Profits: Set your desired risk-reward ratios and portion allocations for each take-profit level. The script supports 1-3 take-profit targets.
Analyze Results: The dashboard will automatically calculate and display position size, number of shares, potential profits/losses, fees, and break-even levels.
Visual Confirmation: Colored boxes on the chart show profit zones (green) and loss zones (red), with lines extending to current price levels.
Reset Entry and SL:
You can easily reset the entry and stop-loss by clicking the "Reset points..." button from the script's "More" menu.
This is useful if you want to quickly clear your current trade setup and start fresh without manually adjusting the points on the chart.
Calculations
The script performs sophisticated calculations including:
Position size based on risk amount and price difference between entry and stop-loss
Leverage requirements and position amount calculations
Fee-adjusted risk-reward ratios for realistic profit expectations
Break-even price including all trading costs
Individual profit calculations for partial position closures
Detailed Take-Profit Calculation Formula:
The take-profit prices are calculated using the following mathematical formula:
// Core variables:
// risk_amount = account_size * (risk_percentage / 100)
// total_risk_per_share = |entry_price - sl_price| + (entry_price * fee%) + (sl_price * fee%)
// shares = risk_amount / total_risk_per_share
// direction_factor = 1 for long positions, -1 for short positions
// Take-profit calculation:
net_win = total_risk_per_share * shares * RR_ratio
tp_price = (net_win + (direction_factor * entry_price * shares) + (entry_price * fee% * shares)) / (direction_factor * shares - fee% * shares)
Step-by-step example for a long position (based on screenshot):
Account Size: 2,000 USDT, Risk: 2% = 40 USDT
Entry: 102,062.9 USDT, Stop Loss: 102,178.4 USDT, Fee: 0.06%
Risk per share: |102,062.9 - 102,178.4| + (102,062.9 × 0.0006) + (102,178.4 × 0.0006) = 115.5 + 61.24 + 61.31 = 238.05 USDT
Shares: 40 ÷ 238.05 = 0.168 shares (rounded to 0.17 in display)
Position Size: 0.17 × 102,062.9 = 17,350.69 USDT
Position Amount (with 9x leverage): 17,350.69 ÷ 9 = 1,927.85 USDT
For 2:1 RR: Net win = 238.05 × 0.17 × 2 = 80.94 USDT
TP1 price = (80.94 + (1 × 102,062.9 × 0.17) + (102,062.9 × 0.0006 × 0.17)) ÷ (1 × 0.17 - 0.0006 × 0.17) = 101,464.7 USDT
For 3:1 RR: TP2 price = 101,226.7 USDT (following same formula with RR=3)
This ensures that after accounting for all fees, the actual risk-reward ratio matches the specified target ratio.
Risk Management Features
Maximum Trade Amount: Optional setting to limit position size regardless of account size
Leverage Limits: Built-in maximum leverage protection
Fee Integration: All calculations include realistic trading fees for accurate expectations
Validation: Automatic checking that take-profit portions sum to 100%
Historical Tracking: Visual indication when stop-loss or take-profit levels are reached (within last 5000 bars)
Understanding Max Trade Amount - Multiple Simultaneous Trades:
The "Max Trade Amount" feature is designed for traders who want to open multiple positions simultaneously while maintaining proper risk management. Here's how it works:
Key Concept:
- Risk percentage (2%) always applies to your full Account Size
- Max Trade Amount limits the capital allocated per individual trade
- This allows multiple trades with full risk on each trade
Example from Screenshot:
Account Size: 2,000 USDT
Max Trade Amount: 500 USDT
Risk per Trade: 2% × 2,000 = 40 USDT per trade
Stop Loss Distance: 0.11% from entry
Result: Position Size = 17,350.69 USDT with 35x leverage
Total Risk (including fees): 40.46 USDT
Multiple Trades Strategy:
With this setup, you can open:
Trade 1: 40 USDT risk, 495.73 USDT position amount (35x leverage)
Trade 2: 40 USDT risk, 495.73 USDT position amount (35x leverage)
Trade 3: 40 USDT risk, 495.73 USDT position amount (35x leverage)
Trade 4: 40 USDT risk, 495.73 USDT position amount (35x leverage)
Total Portfolio Exposure:
- 4 simultaneous trades = 4 × 495.73 = 1,982.92 USDT position amount
- Total risk exposure = 4 × 40 = 160 USDT (8% of account)

Quantum Rotational Field MappingQuantum Rotational Field Mapping (QRFM):
Phase Coherence Detection Through Complex-Plane Oscillator Analysis
Quantum Rotational Field Mapping applies complex-plane mathematics and phase-space analysis to oscillator ensembles, identifying high-probability trend ignition points by measuring when multiple independent oscillators achieve phase coherence. Unlike traditional multi-oscillator approaches that simply stack indicators or use boolean AND/OR logic, this system converts each oscillator into a rotating phasor (vector) in the complex plane and calculates the Coherence Index (CI) —a mathematical measure of how tightly aligned the ensemble has become—then generates signals only when alignment, phase direction, and pairwise entanglement all converge.
The indicator combines three mathematical frameworks: phasor representation using analytic signal theory to extract phase and amplitude from each oscillator, coherence measurement using vector summation in the complex plane to quantify group alignment, and entanglement analysis that calculates pairwise phase agreement across all oscillator combinations. This creates a multi-dimensional confirmation system that distinguishes between random oscillator noise and genuine regime transitions.
What Makes This Original
Complex-Plane Phasor Framework
This indicator implements classical signal processing mathematics adapted for market oscillators. Each oscillator—whether RSI, MACD, Stochastic, CCI, Williams %R, MFI, ROC, or TSI—is first normalized to a common scale, then converted into a complex-plane representation using an in-phase (I) and quadrature (Q) component. The in-phase component is the oscillator value itself, while the quadrature component is calculated as the first difference (derivative proxy), creating a velocity-aware representation.
From these components, the system extracts:
Phase (φ) : Calculated as φ = atan2(Q, I), representing the oscillator's position in its cycle (mapped to -180° to +180°)
Amplitude (A) : Calculated as A = √(I² + Q²), representing the oscillator's strength or conviction
This mathematical approach is fundamentally different from simply reading oscillator values. A phasor captures both where an oscillator is in its cycle (phase angle) and how strongly it's expressing that position (amplitude). Two oscillators can have the same value but be in opposite phases of their cycles—traditional analysis would see them as identical, while QRFM sees them as 180° out of phase (contradictory).
Coherence Index Calculation
The core innovation is the Coherence Index (CI) , borrowed from physics and signal processing. When you have N oscillators, each with phase φₙ, you can represent each as a unit vector in the complex plane: e^(iφₙ) = cos(φₙ) + i·sin(φₙ).
The CI measures what happens when you sum all these vectors:
Resultant Vector : R = Σ e^(iφₙ) = Σ cos(φₙ) + i·Σ sin(φₙ)
Coherence Index : CI = |R| / N
Where |R| is the magnitude of the resultant vector and N is the number of active oscillators.
The CI ranges from 0 to 1:
CI = 1.0 : Perfect coherence—all oscillators have identical phase angles, vectors point in the same direction, creating maximum constructive interference
CI = 0.0 : Complete decoherence—oscillators are randomly distributed around the circle, vectors cancel out through destructive interference
0 < CI < 1 : Partial alignment—some clustering with some scatter
This is not a simple average or correlation. The CI captures phase synchronization across the entire ensemble simultaneously. When oscillators phase-lock (align their cycles), the CI spikes regardless of their individual values. This makes it sensitive to regime transitions that traditional indicators miss.
Dominant Phase and Direction Detection
Beyond measuring alignment strength, the system calculates the dominant phase of the ensemble—the direction the resultant vector points:
Dominant Phase : φ_dom = atan2(Σ sin(φₙ), Σ cos(φₙ))
This gives the "average direction" of all oscillator phases, mapped to -180° to +180°:
+90° to -90° (right half-plane): Bullish phase dominance
+90° to +180° or -90° to -180° (left half-plane): Bearish phase dominance
The combination of CI magnitude (coherence strength) and dominant phase angle (directional bias) creates a two-dimensional signal space. High CI alone is insufficient—you need high CI plus dominant phase pointing in a tradeable direction. This dual requirement is what separates QRFM from simple oscillator averaging.
Entanglement Matrix and Pairwise Coherence
While the CI measures global alignment, the entanglement matrix measures local pairwise relationships. For every pair of oscillators (i, j), the system calculates:
E(i,j) = |cos(φᵢ - φⱼ)|
This represents the phase agreement between oscillators i and j:
E = 1.0 : Oscillators are in-phase (0° or 360° apart)
E = 0.0 : Oscillators are in quadrature (90° apart, orthogonal)
E between 0 and 1 : Varying degrees of alignment
The system counts how many oscillator pairs exceed a user-defined entanglement threshold (e.g., 0.7). This entangled pairs count serves as a confirmation filter: signals require not just high global CI, but also a minimum number of strong pairwise agreements. This prevents false ignitions where CI is high but driven by only two oscillators while the rest remain scattered.
The entanglement matrix creates an N×N symmetric matrix that can be visualized as a web—when many cells are bright (high E values), the ensemble is highly interconnected. When cells are dark, oscillators are moving independently.
Phase-Lock Tolerance Mechanism
A complementary confirmation layer is the phase-lock detector . This calculates the maximum phase spread across all oscillators:
For all pairs (i,j), compute angular distance: Δφ = |φᵢ - φⱼ|, wrapping at 180°
Max Spread = maximum Δφ across all pairs
If max spread < user threshold (e.g., 35°), the ensemble is considered phase-locked —all oscillators are within a narrow angular band.
This differs from entanglement: entanglement measures pairwise cosine similarity (magnitude of alignment), while phase-lock measures maximum angular deviation (tightness of clustering). Both must be satisfied for the highest-conviction signals.
Multi-Layer Visual Architecture
QRFM includes six visual components that represent the same underlying mathematics from different perspectives:
Circular Orbit Plot : A polar coordinate grid showing each oscillator as a vector from origin to perimeter. Angle = phase, radius = amplitude. This is a real-time snapshot of the complex plane. When vectors converge (point in similar directions), coherence is high. When scattered randomly, coherence is low. Users can see phase alignment forming before CI numerically confirms it.
Phase-Time Heat Map : A 2D matrix with rows = oscillators and columns = time bins. Each cell is colored by the oscillator's phase at that time (using a gradient where color hue maps to angle). Horizontal color bands indicate sustained phase alignment over time. Vertical color bands show moments when all oscillators shared the same phase (ignition points). This provides historical pattern recognition.
Entanglement Web Matrix : An N×N grid showing E(i,j) for all pairs. Cells are colored by entanglement strength—bright yellow/gold for high E, dark gray for low E. This reveals which oscillators are driving coherence and which are lagging. For example, if RSI and MACD show high E but Stochastic shows low E with everything, Stochastic is the outlier.
Quantum Field Cloud : A background color overlay on the price chart. Color (green = bullish, red = bearish) is determined by dominant phase. Opacity is determined by CI—high CI creates dense, opaque cloud; low CI creates faint, nearly invisible cloud. This gives an atmospheric "feel" for regime strength without looking at numbers.
Phase Spiral : A smoothed plot of dominant phase over recent history, displayed as a curve that wraps around price. When the spiral is tight and rotating steadily, the ensemble is in coherent rotation (trending). When the spiral is loose or erratic, coherence is breaking down.
Dashboard : A table showing real-time metrics: CI (as percentage), dominant phase (in degrees with directional arrow), field strength (CI × average amplitude), entangled pairs count, phase-lock status (locked/unlocked), quantum state classification ("Ignition", "Coherent", "Collapse", "Chaos"), and collapse risk (recent CI change normalized to 0-100%).
Each component is independently toggleable, allowing users to customize their workspace. The orbit plot is the most essential—it provides intuitive, visual feedback on phase alignment that no numerical dashboard can match.
Core Components and How They Work Together
1. Oscillator Normalization Engine
The foundation is creating a common measurement scale. QRFM supports eight oscillators:
RSI : Normalized from to using overbought/oversold levels (70, 30) as anchors
MACD Histogram : Normalized by dividing by rolling standard deviation, then clamped to
Stochastic %K : Normalized from using (80, 20) anchors
CCI : Divided by 200 (typical extreme level), clamped to
Williams %R : Normalized from using (-20, -80) anchors
MFI : Normalized from using (80, 20) anchors
ROC : Divided by 10, clamped to
TSI : Divided by 50, clamped to
Each oscillator can be individually enabled/disabled. Only active oscillators contribute to phase calculations. The normalization removes scale differences—a reading of +0.8 means "strongly bullish" regardless of whether it came from RSI or TSI.
2. Analytic Signal Construction
For each active oscillator at each bar, the system constructs the analytic signal:
In-Phase (I) : The normalized oscillator value itself
Quadrature (Q) : The bar-to-bar change in the normalized value (first derivative approximation)
This creates a 2D representation: (I, Q). The phase is extracted as:
φ = atan2(Q, I) × (180 / π)
This maps the oscillator to a point on the unit circle. An oscillator at the same value but rising (positive Q) will have a different phase than one that is falling (negative Q). This velocity-awareness is critical—it distinguishes between "at resistance and stalling" versus "at resistance and breaking through."
The amplitude is extracted as:
A = √(I² + Q²)
This represents the distance from origin in the (I, Q) plane. High amplitude means the oscillator is far from neutral (strong conviction). Low amplitude means it's near zero (weak/transitional state).
3. Coherence Calculation Pipeline
For each bar (or every Nth bar if phase sample rate > 1 for performance):
Step 1 : Extract phase φₙ for each of the N active oscillators
Step 2 : Compute complex exponentials: Zₙ = e^(i·φₙ·π/180) = cos(φₙ·π/180) + i·sin(φₙ·π/180)
Step 3 : Sum the complex exponentials: R = Σ Zₙ = (Σ cos φₙ) + i·(Σ sin φₙ)
Step 4 : Calculate magnitude: |R| = √
Step 5 : Normalize by count: CI_raw = |R| / N
Step 6 : Smooth the CI: CI = SMA(CI_raw, smoothing_window)
The smoothing step (default 2 bars) removes single-bar noise spikes while preserving structural coherence changes. Users can adjust this to control reactivity versus stability.
The dominant phase is calculated as:
φ_dom = atan2(Σ sin φₙ, Σ cos φₙ) × (180 / π)
This is the angle of the resultant vector R in the complex plane.
4. Entanglement Matrix Construction
For all unique pairs of oscillators (i, j) where i < j:
Step 1 : Get phases φᵢ and φⱼ
Step 2 : Compute phase difference: Δφ = φᵢ - φⱼ (in radians)
Step 3 : Calculate entanglement: E(i,j) = |cos(Δφ)|
Step 4 : Store in symmetric matrix: matrix = matrix = E(i,j)
The matrix is then scanned: count how many E(i,j) values exceed the user-defined threshold (default 0.7). This count is the entangled pairs metric.
For visualization, the matrix is rendered as an N×N table where cell brightness maps to E(i,j) intensity.
5. Phase-Lock Detection
Step 1 : For all unique pairs (i, j), compute angular distance: Δφ = |φᵢ - φⱼ|
Step 2 : Wrap angles: if Δφ > 180°, set Δφ = 360° - Δφ
Step 3 : Find maximum: max_spread = max(Δφ) across all pairs
Step 4 : Compare to tolerance: phase_locked = (max_spread < tolerance)
If phase_locked is true, all oscillators are within the specified angular cone (e.g., 35°). This is a boolean confirmation filter.
6. Signal Generation Logic
Signals are generated through multi-layer confirmation:
Long Ignition Signal :
CI crosses above ignition threshold (e.g., 0.80)
AND dominant phase is in bullish range (-90° < φ_dom < +90°)
AND phase_locked = true
AND entangled_pairs >= minimum threshold (e.g., 4)
Short Ignition Signal :
CI crosses above ignition threshold
AND dominant phase is in bearish range (φ_dom < -90° OR φ_dom > +90°)
AND phase_locked = true
AND entangled_pairs >= minimum threshold
Collapse Signal :
CI at bar minus CI at current bar > collapse threshold (e.g., 0.55)
AND CI at bar was above 0.6 (must collapse from coherent state, not from already-low state)
These are strict conditions. A high CI alone does not generate a signal—dominant phase must align with direction, oscillators must be phase-locked, and sufficient pairwise entanglement must exist. This multi-factor gating dramatically reduces false signals compared to single-condition triggers.
Calculation Methodology
Phase 1: Oscillator Computation and Normalization
On each bar, the system calculates the raw values for all enabled oscillators using standard Pine Script functions:
RSI: ta.rsi(close, length)
MACD: ta.macd() returning histogram component
Stochastic: ta.stoch() smoothed with ta.sma()
CCI: ta.cci(close, length)
Williams %R: ta.wpr(length)
MFI: ta.mfi(hlc3, length)
ROC: ta.roc(close, length)
TSI: ta.tsi(close, short, long)
Each raw value is then passed through a normalization function:
normalize(value, overbought_level, oversold_level) = 2 × (value - oversold) / (overbought - oversold) - 1
This maps the oscillator's typical range to , where -1 represents extreme bearish, 0 represents neutral, and +1 represents extreme bullish.
For oscillators without fixed ranges (MACD, ROC, TSI), statistical normalization is used: divide by a rolling standard deviation or fixed divisor, then clamp to .
Phase 2: Phasor Extraction
For each normalized oscillator value val:
I = val (in-phase component)
Q = val - val (quadrature component, first difference)
Phase calculation:
phi_rad = atan2(Q, I)
phi_deg = phi_rad × (180 / π)
Amplitude calculation:
A = √(I² + Q²)
These values are stored in arrays: osc_phases and osc_amps for each oscillator n.
Phase 3: Complex Summation and Coherence
Initialize accumulators:
sum_cos = 0
sum_sin = 0
For each oscillator n = 0 to N-1:
phi_rad = osc_phases × (π / 180)
sum_cos += cos(phi_rad)
sum_sin += sin(phi_rad)
Resultant magnitude:
resultant_mag = √(sum_cos² + sum_sin²)
Coherence Index (raw):
CI_raw = resultant_mag / N
Smoothed CI:
CI = SMA(CI_raw, smoothing_window)
Dominant phase:
phi_dom_rad = atan2(sum_sin, sum_cos)
phi_dom_deg = phi_dom_rad × (180 / π)
Phase 4: Entanglement Matrix Population
For i = 0 to N-2:
For j = i+1 to N-1:
phi_i = osc_phases × (π / 180)
phi_j = osc_phases × (π / 180)
delta_phi = phi_i - phi_j
E = |cos(delta_phi)|
matrix_index_ij = i × N + j
matrix_index_ji = j × N + i
entangle_matrix = E
entangle_matrix = E
if E >= threshold:
entangled_pairs += 1
The matrix uses flat array storage with index mapping: index(row, col) = row × N + col.
Phase 5: Phase-Lock Check
max_spread = 0
For i = 0 to N-2:
For j = i+1 to N-1:
delta = |osc_phases - osc_phases |
if delta > 180:
delta = 360 - delta
max_spread = max(max_spread, delta)
phase_locked = (max_spread < tolerance)
Phase 6: Signal Evaluation
Ignition Long :
ignition_long = (CI crosses above threshold) AND
(phi_dom > -90 AND phi_dom < 90) AND
phase_locked AND
(entangled_pairs >= minimum)
Ignition Short :
ignition_short = (CI crosses above threshold) AND
(phi_dom < -90 OR phi_dom > 90) AND
phase_locked AND
(entangled_pairs >= minimum)
Collapse :
CI_prev = CI
collapse = (CI_prev - CI > collapse_threshold) AND (CI_prev > 0.6)
All signals are evaluated on bar close. The crossover and crossunder functions ensure signals fire only once when conditions transition from false to true.
Phase 7: Field Strength and Visualization Metrics
Average Amplitude :
avg_amp = (Σ osc_amps ) / N
Field Strength :
field_strength = CI × avg_amp
Collapse Risk (for dashboard):
collapse_risk = (CI - CI) / max(CI , 0.1)
collapse_risk_pct = clamp(collapse_risk × 100, 0, 100)
Quantum State Classification :
if (CI > threshold AND phase_locked):
state = "Ignition"
else if (CI > 0.6):
state = "Coherent"
else if (collapse):
state = "Collapse"
else:
state = "Chaos"
Phase 8: Visual Rendering
Orbit Plot : For each oscillator, convert polar (phase, amplitude) to Cartesian (x, y) for grid placement:
radius = amplitude × grid_center × 0.8
x = radius × cos(phase × π/180)
y = radius × sin(phase × π/180)
col = center + x (mapped to grid coordinates)
row = center - y
Heat Map : For each oscillator row and time column, retrieve historical phase value at lookback = (columns - col) × sample_rate, then map phase to color using a hue gradient.
Entanglement Web : Render matrix as table cell with background color opacity = E(i,j).
Field Cloud : Background color = (phi_dom > -90 AND phi_dom < 90) ? green : red, with opacity = mix(min_opacity, max_opacity, CI).
All visual components render only on the last bar (barstate.islast) to minimize computational overhead.
How to Use This Indicator
Step 1 : Apply QRFM to your chart. It works on all timeframes and asset classes, though 15-minute to 4-hour timeframes provide the best balance of responsiveness and noise reduction.
Step 2 : Enable the dashboard (default: top right) and the circular orbit plot (default: middle left). These are your primary visual feedback tools.
Step 3 : Optionally enable the heat map, entanglement web, and field cloud based on your preference. New users may find all visuals overwhelming; start with dashboard + orbit plot.
Step 4 : Observe for 50-100 bars to let the indicator establish baseline coherence patterns. Markets have different "normal" CI ranges—some instruments naturally run higher or lower coherence.
Understanding the Circular Orbit Plot
The orbit plot is a polar grid showing oscillator vectors in real-time:
Center point : Neutral (zero phase and amplitude)
Each vector : A line from center to a point on the grid
Vector angle : The oscillator's phase (0° = right/east, 90° = up/north, 180° = left/west, -90° = down/south)
Vector length : The oscillator's amplitude (short = weak signal, long = strong signal)
Vector label : First letter of oscillator name (R = RSI, M = MACD, etc.)
What to watch :
Convergence : When all vectors cluster in one quadrant or sector, CI is rising and coherence is forming. This is your pre-signal warning.
Scatter : When vectors point in random directions (360° spread), CI is low and the market is in a non-trending or transitional regime.
Rotation : When the cluster rotates smoothly around the circle, the ensemble is in coherent oscillation—typically seen during steady trends.
Sudden flips : When the cluster rapidly jumps from one side to the opposite (e.g., +90° to -90°), a phase reversal has occurred—often coinciding with trend reversals.
Example: If you see RSI, MACD, and Stochastic all pointing toward 45° (northeast) with long vectors, while CCI, TSI, and ROC point toward 40-50° as well, coherence is high and dominant phase is bullish. Expect an ignition signal if CI crosses threshold.
Reading Dashboard Metrics
The dashboard provides numerical confirmation of what the orbit plot shows visually:
CI : Displays as 0-100%. Above 70% = high coherence (strong regime), 40-70% = moderate, below 40% = low (poor conditions for trend entries).
Dom Phase : Angle in degrees with directional arrow. ⬆ = bullish bias, ⬇ = bearish bias, ⬌ = neutral.
Field Strength : CI weighted by amplitude. High values (> 0.6) indicate not just alignment but strong alignment.
Entangled Pairs : Count of oscillator pairs with E > threshold. Higher = more confirmation. If minimum is set to 4, you need at least 4 pairs entangled for signals.
Phase Lock : 🔒 YES (all oscillators within tolerance) or 🔓 NO (spread too wide).
State : Real-time classification:
🚀 IGNITION: CI just crossed threshold with phase-lock
⚡ COHERENT: CI is high and stable
💥 COLLAPSE: CI has dropped sharply
🌀 CHAOS: Low CI, scattered phases
Collapse Risk : 0-100% scale based on recent CI change. Above 50% warns of imminent breakdown.
Interpreting Signals
Long Ignition (Blue Triangle Below Price) :
Occurs when CI crosses above threshold (e.g., 0.80)
Dominant phase is in bullish range (-90° to +90°)
All oscillators are phase-locked (within tolerance)
Minimum entangled pairs requirement met
Interpretation : The oscillator ensemble has transitioned from disorder to coherent bullish alignment. This is a high-probability long entry point. The multi-layer confirmation (CI + phase direction + lock + entanglement) ensures this is not a single-oscillator whipsaw.
Short Ignition (Red Triangle Above Price) :
Same conditions as long, but dominant phase is in bearish range (< -90° or > +90°)
Interpretation : Coherent bearish alignment has formed. High-probability short entry.
Collapse (Circles Above and Below Price) :
CI has dropped by more than the collapse threshold (e.g., 0.55) over a 5-bar window
CI was previously above 0.6 (collapsing from coherent state)
Interpretation : Phase coherence has broken down. If you are in a position, this is an exit warning. If looking to enter, stand aside—regime is transitioning.
Phase-Time Heat Map Patterns
Enable the heat map and position it at bottom right. The rows represent individual oscillators, columns represent time bins (most recent on left).
Pattern: Horizontal Color Bands
If a row (e.g., RSI) shows consistent color across columns (say, green for several bins), that oscillator has maintained stable phase over time. If all rows show horizontal bands of similar color, the entire ensemble has been phase-locked for an extended period—this is a strong trending regime.
Pattern: Vertical Color Bands
If a column (single time bin) shows all cells with the same or very similar color, that moment in time had high coherence. These vertical bands often align with ignition signals or major price pivots.
Pattern: Rainbow Chaos
If cells are random colors (red, green, yellow mixed with no pattern), coherence is low. The ensemble is scattered. Avoid trading during these periods unless you have external confirmation.
Pattern: Color Transition
If you see a row transition from red to green (or vice versa) sharply, that oscillator has phase-flipped. If multiple rows do this simultaneously, a regime change is underway.
Entanglement Web Analysis
Enable the web matrix (default: opposite corner from heat map). It shows an N×N grid where N = number of active oscillators.
Bright Yellow/Gold Cells : High pairwise entanglement. For example, if the RSI-MACD cell is bright gold, those two oscillators are moving in phase. If the RSI-Stochastic cell is bright, they are entangled as well.
Dark Gray Cells : Low entanglement. Oscillators are decorrelated or in quadrature.
Diagonal : Always marked with "—" because an oscillator is always perfectly entangled with itself.
How to use :
Scan for clustering: If most cells are bright, coherence is high across the board. If only a few cells are bright, coherence is driven by a subset (e.g., RSI and MACD are aligned, but nothing else is—weak signal).
Identify laggards: If one row/column is entirely dark, that oscillator is the outlier. You may choose to disable it or monitor for when it joins the group (late confirmation).
Watch for web formation: During low-coherence periods, the matrix is mostly dark. As coherence builds, cells begin lighting up. A sudden "web" of connections forming visually precedes ignition signals.
Trading Workflow
Step 1: Monitor Coherence Level
Check the dashboard CI metric or observe the orbit plot. If CI is below 40% and vectors are scattered, conditions are poor for trend entries. Wait.
Step 2: Detect Coherence Building
When CI begins rising (say, from 30% to 50-60%) and you notice vectors on the orbit plot starting to cluster, coherence is forming. This is your alert phase—do not enter yet, but prepare.
Step 3: Confirm Phase Direction
Check the dominant phase angle and the orbit plot quadrant where clustering is occurring:
Clustering in right half (0° to ±90°): Bullish bias forming
Clustering in left half (±90° to 180°): Bearish bias forming
Verify the dashboard shows the corresponding directional arrow (⬆ or ⬇).
Step 4: Wait for Signal Confirmation
Do not enter based on rising CI alone. Wait for the full ignition signal:
CI crosses above threshold
Phase-lock indicator shows 🔒 YES
Entangled pairs count >= minimum
Directional triangle appears on chart
This ensures all layers have aligned.
Step 5: Execute Entry
Long : Blue triangle below price appears → enter long
Short : Red triangle above price appears → enter short
Step 6: Position Management
Initial Stop : Place stop loss based on your risk management rules (e.g., recent swing low/high, ATR-based buffer).
Monitoring :
Watch the field cloud density. If it remains opaque and colored in your direction, the regime is intact.
Check dashboard collapse risk. If it rises above 50%, prepare for exit.
Monitor the orbit plot. If vectors begin scattering or the cluster flips to the opposite side, coherence is breaking.
Exit Triggers :
Collapse signal fires (circles appear)
Dominant phase flips to opposite half-plane
CI drops below 40% (coherence lost)
Price hits your profit target or trailing stop
Step 7: Post-Exit Analysis
After exiting, observe whether a new ignition forms in the opposite direction (reversal) or if CI remains low (transition to range). Use this to decide whether to re-enter, reverse, or stand aside.
Best Practices
Use Price Structure as Context
QRFM identifies when coherence forms but does not specify where price will go. Combine ignition signals with support/resistance levels, trendlines, or chart patterns. For example:
Long ignition near a major support level after a pullback: high-probability bounce
Long ignition in the middle of a range with no structure: lower probability
Multi-Timeframe Confirmation
Open QRFM on two timeframes simultaneously:
Higher timeframe (e.g., 4-hour): Use CI level to determine regime bias. If 4H CI is above 60% and dominant phase is bullish, the market is in a bullish regime.
Lower timeframe (e.g., 15-minute): Execute entries on ignition signals that align with the higher timeframe bias.
This prevents counter-trend trades and increases win rate.
Distinguish Between Regime Types
High CI, stable dominant phase (State: Coherent) : Trending market. Ignitions are continuation signals; collapses are profit-taking or reversal warnings.
Low CI, erratic dominant phase (State: Chaos) : Ranging or choppy market. Avoid ignition signals or reduce position size. Wait for coherence to establish.
Moderate CI with frequent collapses : Whipsaw environment. Use wider stops or stand aside.
Adjust Parameters to Instrument and Timeframe
Crypto/Forex (high volatility) : Lower ignition threshold (0.65-0.75), lower CI smoothing (2-3), shorter oscillator lengths (7-10).
Stocks/Indices (moderate volatility) : Standard settings (threshold 0.75-0.85, smoothing 5-7, oscillator lengths 14).
Lower timeframes (5-15 min) : Reduce phase sample rate to 1-2 for responsiveness.
Higher timeframes (daily+) : Increase CI smoothing and oscillator lengths for noise reduction.
Use Entanglement Count as Conviction Filter
The minimum entangled pairs setting controls signal strictness:
Low (1-2) : More signals, lower quality (acceptable if you have other confirmation)
Medium (3-5) : Balanced (recommended for most traders)
High (6+) : Very strict, fewer signals, highest quality
Adjust based on your trade frequency preference and risk tolerance.
Monitor Oscillator Contribution
Use the entanglement web to see which oscillators are driving coherence. If certain oscillators are consistently dark (low E with all others), they may be adding noise. Consider disabling them. For example:
On low-volume instruments, MFI may be unreliable → disable MFI
On strongly trending instruments, mean-reversion oscillators (Stochastic, RSI) may lag → reduce weight or disable
Respect the Collapse Signal
Collapse events are early warnings. Price may continue in the original direction for several bars after collapse fires, but the underlying regime has weakened. Best practice:
If in profit: Take partial or full profit on collapse
If at breakeven/small loss: Exit immediately
If collapse occurs shortly after entry: Likely a false ignition; exit to avoid drawdown
Collapses do not guarantee immediate reversals—they signal uncertainty .
Combine with Volume Analysis
If your instrument has reliable volume:
Ignitions with expanding volume: Higher conviction
Ignitions with declining volume: Weaker, possibly false
Collapses with volume spikes: Strong reversal signal
Collapses with low volume: May just be consolidation
Volume is not built into QRFM (except via MFI), so add it as external confirmation.
Observe the Phase Spiral
The spiral provides a quick visual cue for rotation consistency:
Tight, smooth spiral : Ensemble is rotating coherently (trending)
Loose, erratic spiral : Phase is jumping around (ranging or transitional)
If the spiral tightens, coherence is building. If it loosens, coherence is dissolving.
Do Not Overtrade Low-Coherence Periods
When CI is persistently below 40% and the state is "Chaos," the market is not in a regime where phase analysis is predictive. During these times:
Reduce position size
Widen stops
Wait for coherence to return
QRFM's strength is regime detection. If there is no regime, the tool correctly signals "stand aside."
Use Alerts Strategically
Set alerts for:
Long Ignition
Short Ignition
Collapse
Phase Lock (optional)
Configure alerts to "Once per bar close" to avoid intrabar repainting and noise. When an alert fires, manually verify:
Orbit plot shows clustering
Dashboard confirms all conditions
Price structure supports the trade
Do not blindly trade alerts—use them as prompts for analysis.
Ideal Market Conditions
Best Performance
Instruments :
Liquid, actively traded markets (major forex pairs, large-cap stocks, major indices, top-tier crypto)
Instruments with clear cyclical oscillator behavior (avoid extremely illiquid or manipulated markets)
Timeframes :
15-minute to 4-hour: Optimal balance of noise reduction and responsiveness
1-hour to daily: Slower, higher-conviction signals; good for swing trading
5-minute: Acceptable for scalping if parameters are tightened and you accept more noise
Market Regimes :
Trending markets with periodic retracements (where oscillators cycle through phases predictably)
Breakout environments (coherence forms before/during breakout; collapse occurs at exhaustion)
Rotational markets with clear swings (oscillators phase-lock at turning points)
Volatility :
Moderate to high volatility (oscillators have room to move through their ranges)
Stable volatility regimes (sudden VIX spikes or flash crashes may create false collapses)
Challenging Conditions
Instruments :
Very low liquidity markets (erratic price action creates unstable oscillator phases)
Heavily news-driven instruments (fundamentals may override technical coherence)
Highly correlated instruments (oscillators may all reflect the same underlying factor, reducing independence)
Market Regimes :
Deep, prolonged consolidation (oscillators remain near neutral, CI is chronically low, few signals fire)
Extreme chop with no directional bias (oscillators whipsaw, coherence never establishes)
Gap-driven markets (large overnight gaps create phase discontinuities)
Timeframes :
Sub-5-minute charts: Noise dominates; oscillators flip rapidly; coherence is fleeting and unreliable
Weekly/monthly: Oscillators move extremely slowly; signals are rare; better suited for long-term positioning than active trading
Special Cases :
During major economic releases or earnings: Oscillators may lag price or become decorrelated as fundamentals overwhelm technicals. Reduce position size or stand aside.
In extremely low-volatility environments (e.g., holiday periods): Oscillators compress to neutral, CI may be artificially high due to lack of movement, but signals lack follow-through.
Adaptive Behavior
QRFM is designed to self-adapt to poor conditions:
When coherence is genuinely absent, CI remains low and signals do not fire
When only a subset of oscillators aligns, entangled pairs count stays below threshold and signals are filtered out
When phase-lock cannot be achieved (oscillators too scattered), the lock filter prevents signals
This means the indicator will naturally produce fewer (or zero) signals during unfavorable conditions, rather than generating false signals. This is a feature —it keeps you out of low-probability trades.
Parameter Optimization by Trading Style
Scalping (5-15 Minute Charts)
Goal : Maximum responsiveness, accept higher noise
Oscillator Lengths :
RSI: 7-10
MACD: 8/17/6
Stochastic: 8-10, smooth 2-3
CCI: 14-16
Others: 8-12
Coherence Settings :
CI Smoothing Window: 2-3 bars (fast reaction)
Phase Sample Rate: 1 (every bar)
Ignition Threshold: 0.65-0.75 (lower for more signals)
Collapse Threshold: 0.40-0.50 (earlier exit warnings)
Confirmation :
Phase Lock Tolerance: 40-50° (looser, easier to achieve)
Min Entangled Pairs: 2-3 (fewer oscillators required)
Visuals :
Orbit Plot + Dashboard only (reduce screen clutter for fast decisions)
Disable heavy visuals (heat map, web) for performance
Alerts :
Enable all ignition and collapse alerts
Set to "Once per bar close"
Day Trading (15-Minute to 1-Hour Charts)
Goal : Balance between responsiveness and reliability
Oscillator Lengths :
RSI: 14 (standard)
MACD: 12/26/9 (standard)
Stochastic: 14, smooth 3
CCI: 20
Others: 10-14
Coherence Settings :
CI Smoothing Window: 3-5 bars (balanced)
Phase Sample Rate: 2-3
Ignition Threshold: 0.75-0.85 (moderate selectivity)
Collapse Threshold: 0.50-0.55 (balanced exit timing)
Confirmation :
Phase Lock Tolerance: 30-40° (moderate tightness)
Min Entangled Pairs: 4-5 (reasonable confirmation)
Visuals :
Orbit Plot + Dashboard + Heat Map or Web (choose one)
Field Cloud for regime backdrop
Alerts :
Ignition and collapse alerts
Optional phase-lock alert for advance warning
Swing Trading (4-Hour to Daily Charts)
Goal : High-conviction signals, minimal noise, fewer trades
Oscillator Lengths :
RSI: 14-21
MACD: 12/26/9 or 19/39/9 (longer variant)
Stochastic: 14-21, smooth 3-5
CCI: 20-30
Others: 14-20
Coherence Settings :
CI Smoothing Window: 5-10 bars (very smooth)
Phase Sample Rate: 3-5
Ignition Threshold: 0.80-0.90 (high bar for entry)
Collapse Threshold: 0.55-0.65 (only significant breakdowns)
Confirmation :
Phase Lock Tolerance: 20-30° (tight clustering required)
Min Entangled Pairs: 5-7 (strong confirmation)
Visuals :
All modules enabled (you have time to analyze)
Heat Map for multi-bar pattern recognition
Web for deep confirmation analysis
Alerts :
Ignition and collapse
Review manually before entering (no rush)
Position/Long-Term Trading (Daily to Weekly Charts)
Goal : Rare, very high-conviction regime shifts
Oscillator Lengths :
RSI: 21-30
MACD: 19/39/9 or 26/52/12
Stochastic: 21, smooth 5
CCI: 30-50
Others: 20-30
Coherence Settings :
CI Smoothing Window: 10-14 bars
Phase Sample Rate: 5 (every 5th bar to reduce computation)
Ignition Threshold: 0.85-0.95 (only extreme alignment)
Collapse Threshold: 0.60-0.70 (major regime breaks only)
Confirmation :
Phase Lock Tolerance: 15-25° (very tight)
Min Entangled Pairs: 6+ (broad consensus required)
Visuals :
Dashboard + Orbit Plot for quick checks
Heat Map to study historical coherence patterns
Web to verify deep entanglement
Alerts :
Ignition only (collapses are less critical on long timeframes)
Manual review with fundamental analysis overlay
Performance Optimization (Low-End Systems)
If you experience lag or slow rendering:
Reduce Visual Load :
Orbit Grid Size: 8-10 (instead of 12+)
Heat Map Time Bins: 5-8 (instead of 10+)
Disable Web Matrix entirely if not needed
Disable Field Cloud and Phase Spiral
Reduce Calculation Frequency :
Phase Sample Rate: 5-10 (calculate every 5-10 bars)
Max History Depth: 100-200 (instead of 500+)
Disable Unused Oscillators :
If you only want RSI, MACD, and Stochastic, disable the other five. Fewer oscillators = smaller matrices, faster loops.
Simplify Dashboard :
Choose "Small" dashboard size
Reduce number of metrics displayed
These settings will not significantly degrade signal quality (signals are based on bar-close calculations, which remain accurate), but will improve chart responsiveness.
Important Disclaimers
This indicator is a technical analysis tool designed to identify periods of phase coherence across an ensemble of oscillators. It is not a standalone trading system and does not guarantee profitable trades. The Coherence Index, dominant phase, and entanglement metrics are mathematical calculations applied to historical price data—they measure past oscillator behavior and do not predict future price movements with certainty.
No Predictive Guarantee : High coherence indicates that oscillators are currently aligned, which historically has coincided with trending or directional price movement. However, past alignment does not guarantee future trends. Markets can remain coherent while prices consolidate, or lose coherence suddenly due to news, liquidity changes, or other factors not captured by oscillator mathematics.
Signal Confirmation is Probabilistic : The multi-layer confirmation system (CI threshold + dominant phase + phase-lock + entanglement) is designed to filter out low-probability setups. This increases the proportion of valid signals relative to false signals, but does not eliminate false signals entirely. Users should combine QRFM with additional analysis—support and resistance levels, volume confirmation, multi-timeframe alignment, and fundamental context—before executing trades.
Collapse Signals are Warnings, Not Reversals : A coherence collapse indicates that the oscillator ensemble has lost alignment. This often precedes trend exhaustion or reversals, but can also occur during healthy pullbacks or consolidations. Price may continue in the original direction after a collapse. Use collapses as risk management cues (tighten stops, take partial profits) rather than automatic reversal entries.
Market Regime Dependency : QRFM performs best in markets where oscillators exhibit cyclical, mean-reverting behavior and where trends are punctuated by retracements. In markets dominated by fundamental shocks, gap openings, or extreme low-liquidity conditions, oscillator coherence may be less reliable. During such periods, reduce position size or stand aside.
Risk Management is Essential : All trading involves risk of loss. Use appropriate stop losses, position sizing, and risk-per-trade limits. The indicator does not specify stop loss or take profit levels—these must be determined by the user based on their risk tolerance and account size. Never risk more than you can afford to lose.
Parameter Sensitivity : The indicator's behavior changes with input parameters. Aggressive settings (low thresholds, loose tolerances) produce more signals with lower average quality. Conservative settings (high thresholds, tight tolerances) produce fewer signals with higher average quality. Users should backtest and forward-test parameter sets on their specific instruments and timeframes before committing real capital.
No Repainting by Design : All signal conditions are evaluated on bar close using bar-close values. However, the visual components (orbit plot, heat map, dashboard) update in real-time during bar formation for monitoring purposes. For trade execution, rely on the confirmed signals (triangles and circles) that appear only after the bar closes.
Computational Load : QRFM performs extensive calculations, including nested loops for entanglement matrices and real-time table rendering. On lower-powered devices or when running multiple indicators simultaneously, users may experience lag. Use the performance optimization settings (reduce visual complexity, increase phase sample rate, disable unused oscillators) to improve responsiveness.
This system is most effective when used as one component within a broader trading methodology that includes sound risk management, multi-timeframe analysis, market context awareness, and disciplined execution. It is a tool for regime detection and signal confirmation, not a substitute for comprehensive trade planning.
Technical Notes
Calculation Timing : All signal logic (ignition, collapse) is evaluated using bar-close values. The barstate.isconfirmed or implicit bar-close behavior ensures signals do not repaint. Visual components (tables, plots) render on every tick for real-time feedback but do not affect signal generation.
Phase Wrapping : Phase angles are calculated in the range -180° to +180° using atan2. Angular distance calculations account for wrapping (e.g., the distance between +170° and -170° is 20°, not 340°). This ensures phase-lock detection works correctly across the ±180° boundary.
Array Management : The indicator uses fixed-size arrays for oscillator phases, amplitudes, and the entanglement matrix. The maximum number of oscillators is 8. If fewer oscillators are enabled, array sizes shrink accordingly (only active oscillators are processed).
Matrix Indexing : The entanglement matrix is stored as a flat array with size N×N, where N is the number of active oscillators. Index mapping: index(row, col) = row × N + col. Symmetric pairs (i,j) and (j,i) are stored identically.
Normalization Stability : Oscillators are normalized to using fixed reference levels (e.g., RSI overbought/oversold at 70/30). For unbounded oscillators (MACD, ROC, TSI), statistical normalization (division by rolling standard deviation) is used, with clamping to prevent extreme outliers from distorting phase calculations.
Smoothing and Lag : The CI smoothing window (SMA) introduces lag proportional to the window size. This is intentional—it filters out single-bar noise spikes in coherence. Users requiring faster reaction can reduce the smoothing window to 1-2 bars, at the cost of increased sensitivity to noise.
Complex Number Representation : Pine Script does not have native complex number types. Complex arithmetic is implemented using separate real and imaginary accumulators (sum_cos, sum_sin) and manual calculation of magnitude (sqrt(real² + imag²)) and argument (atan2(imag, real)).
Lookback Limits : The indicator respects Pine Script's maximum lookback constraints. Historical phase and amplitude values are accessed using the operator, with lookback limited to the chart's available bar history (max_bars_back=5000 declared).
Visual Rendering Performance : Tables (orbit plot, heat map, web, dashboard) are conditionally deleted and recreated on each update using table.delete() and table.new(). This prevents memory leaks but incurs redraw overhead. Rendering is restricted to barstate.islast (last bar) to minimize computational load—historical bars do not render visuals.
Alert Condition Triggers : alertcondition() functions evaluate on bar close when their boolean conditions transition from false to true. Alerts do not fire repeatedly while a condition remains true (e.g., CI stays above threshold for 10 bars fires only once on the initial cross).
Color Gradient Functions : The phaseColor() function maps phase angles to RGB hues using sine waves offset by 120° (red, green, blue channels). This creates a continuous spectrum where -180° to +180° spans the full color wheel. The amplitudeColor() function maps amplitude to grayscale intensity. The coherenceColor() function uses cos(phase) to map contribution to CI (positive = green, negative = red).
No External Data Requests : QRFM operates entirely on the chart's symbol and timeframe. It does not use request.security() or access external data sources. All calculations are self-contained, avoiding lookahead bias from higher-timeframe requests.
Deterministic Behavior : Given identical input parameters and price data, QRFM produces identical outputs. There are no random elements, probabilistic sampling, or time-of-day dependencies.
— Dskyz, Engineering precision. Trading coherence.

Hidden Impulse═══════════════════════════════════════════════════════════════════
HIDDEN IMPULSE - Multi-Timeframe Momentum Detection System
═══════════════════════════════════════════════════════════════════
OVERVIEW
Hidden Impulse is an advanced momentum oscillator that combines the Schaff Trend Cycle (STC) and Force Index into a comprehensive multi-timeframe trading system. Unlike standard implementations of these indicators, this script introduces three distinct trading setups with specific entry conditions, multi-timeframe confirmation, and trend filtering.
═══════════════════════════════════════════════════════════════════
ORIGINALITY & KEY FEATURES
This indicator is original in the following ways:
1. DUAL-TIMEFRAME STC ANALYSIS
Standard STC implementations work on a single timeframe. This script
simultaneously analyzes STC on both your trading timeframe and a higher
timeframe, providing trend context and filtering out low-probability signals.
2. FORCE INDEX INTEGRATION
The script combines STC with Force Index (volume-weighted price momentum)
to confirm the strength behind price moves. This combination helps identify
when momentum shifts are backed by genuine buying/selling pressure.
3. THREE DISTINCT TRADING SETUPS
Rather than generic overbought/oversold signals, the indicator provides
three specific, rule-based setups:
- Setup A: Classic trend-following entries with multi-timeframe confirmation
- Setup B: Divergence-based reversal entries (highest probability)
- Setup C: Mean-reversion bounce trades at extreme levels
4. INTELLIGENT FILTERING
All signals are filtered through:
- 50 EMA trend direction (prevents counter-trend trades)
- Higher timeframe STC alignment (ensures macro trend agreement)
- Force Index confirmation (validates volume support)
═══════════════════════════════════════════════════════════════════
HOW IT WORKS - TECHNICAL EXPLANATION
SCHAFF TREND CYCLE (STC) CALCULATION:
The STC is a cyclical oscillator that combines MACD concepts with stochastic
smoothing to create earlier and smoother trend signals.
Step 1: Calculate MACD
- Fast MA = EMA(close, Length1) — default 23
- Slow MA = EMA(close, Length2) — default 50
- MACD Line = Fast MA - Slow MA
Step 2: First Stochastic Smoothing
- Apply stochastic calculation to MACD
- Stoch1 = 100 × (MACD - Lowest(MACD, Smoothing)) / (Highest(MACD, Smoothing) - Lowest(MACD, Smoothing))
- Smooth result with EMA(Stoch1, Smoothing) — default 10
Step 3: Second Stochastic Smoothing
- Apply stochastic calculation again to the smoothed stochastic
- This creates the final STC value between 0-100
The dual stochastic smoothing makes STC more responsive than MACD while
being smoother than traditional stochastics.
FORCE INDEX CALCULATION:
Force Index measures the power behind price movements by incorporating volume:
Force Raw = (Close - Close ) × Volume
Force Index = EMA(Force Raw, Period) — default 13
Interpretation:
- Positive Force Index = Buying pressure (bulls in control)
- Negative Force Index = Selling pressure (bears in control)
- Force Index crossing zero = Momentum shift
- Divergences with price = Weakening momentum (reversal signal)
TREND FILTER:
A 50-period EMA serves as the trend filter:
- Price above EMA50 = Uptrend → Only LONG signals allowed
- Price below EMA50 = Downtrend → Only SHORT signals allowed
This prevents counter-trend trading which accounts for most losing trades.
═══════════════════════════════════════════════════════════════════
THE THREE TRADING SETUPS - DETAILED
SETUP A: CLASSIC MOMENTUM ENTRY
Concept: Enter when STC exits oversold/overbought zones with trend confirmation
LONG CONDITIONS:
1. Higher timeframe STC > 25 (macro trend is up)
2. Primary timeframe STC crosses above 25 (momentum turning up)
3. Force Index crosses above 0 OR already positive (volume confirms)
4. Price above 50 EMA (local trend is up)
SHORT CONDITIONS:
1. Higher timeframe STC < 75 (macro trend is down)
2. Primary timeframe STC crosses below 75 (momentum turning down)
3. Force Index crosses below 0 OR already negative (volume confirms)
4. Price below 50 EMA (local trend is down)
Best for: Trending markets, continuation trades
Win rate: Moderate (60-65%)
Risk/Reward: 1:2 to 1:3
───────────────────────────────────────────────────────────────────
SETUP B: DIVERGENCE REVERSAL (HIGHEST PROBABILITY)
Concept: Identify exhaustion points where price makes new extremes but
momentum (Force Index) fails to confirm
BULLISH DIVERGENCE:
1. Price makes a lower low (LL) over 10 bars
2. Force Index makes a higher low (HL) — refuses to follow price down
3. STC is below 25 (oversold condition)
Trigger: STC starts rising AND Force Index crosses above zero
BEARISH DIVERGENCE:
1. Price makes a higher high (HH) over 10 bars
2. Force Index makes a lower high (LH) — refuses to follow price up
3. STC is above 75 (overbought condition)
Trigger: STC starts falling AND Force Index crosses below zero
Why this works: Divergences signal that the current trend is losing steam.
When volume (Force Index) doesn't confirm new price extremes, a reversal
is likely.
Best for: Reversal trading, range-bound markets
Win rate: High (70-75%)
Risk/Reward: 1:3 to 1:5
───────────────────────────────────────────────────────────────────
SETUP C: QUICK BOUNCE AT EXTREMES
Concept: Catch rapid mean-reversion moves when price touches EMA50 in
extreme STC zones
LONG CONDITIONS:
1. Price touches 50 EMA from above (pullback in uptrend)
2. STC < 15 (extreme oversold)
3. Force Index > 0 (buyers stepping in)
SHORT CONDITIONS:
1. Price touches 50 EMA from below (pullback in downtrend)
2. STC > 85 (extreme overbought)
3. Force Index < 0 (sellers stepping in)
Best for: Scalping, quick mean-reversion trades
Win rate: Moderate (55-60%)
Risk/Reward: 1:1 to 1:2
Note: Use tighter stops and quick profit-taking
═══════════════════════════════════════════════════════════════════
HOW TO USE THE INDICATOR
STEP 1: CONFIGURE TIMEFRAMES
Primary Timeframe (STC - Primary Timeframe):
- Leave empty to use your current chart timeframe
- This is where you'll take trades
Higher Timeframe (STC - Higher Timeframe):
- Default: 30 minutes
- Recommended ratios:
* 5min chart → 30min higher TF
* 15min chart → 1H higher TF
* 1H chart → 4H higher TF
* Daily chart → Weekly higher TF
───────────────────────────────────────────────────────────────────
STEP 2: ADJUST STC PARAMETERS FOR YOUR MARKET
Default (23/50/10) works well for stocks and forex, but adjust for:
CRYPTO (volatile):
- Length 1: 15
- Length 2: 35
- Smoothing: 8
(Faster response for rapid price movements)
STOCKS (standard):
- Length 1: 23
- Length 2: 50
- Smoothing: 10
(Balanced settings)
FOREX MAJORS (slower):
- Length 1: 30
- Length 2: 60
- Smoothing: 12
(Filters out noise in 24/7 markets)
───────────────────────────────────────────────────────────────────
STEP 3: ENABLE YOUR PREFERRED SETUPS
Toggle setups based on your trading style:
Conservative Trader:
✓ Setup B (Divergence) — highest win rate
✗ Setup A (Classic) — only in strong trends
✗ Setup C (Bounce) — too aggressive
Trend Trader:
✓ Setup A (Classic) — primary signals
✓ Setup B (Divergence) — for entries on pullbacks
✗ Setup C (Bounce) — not suitable for trending
Scalper:
✓ Setup C (Bounce) — quick in-and-out
✓ Setup B (Divergence) — high probability scalps
✗ Setup A (Classic) — too slow
───────────────────────────────────────────────────────────────────
STEP 4: READ THE SIGNALS
ON THE CHART:
Labels appear when conditions are met:
Green labels:
- "LONG A" — Setup A long entry
- "LONG B DIV" — Setup B divergence long (best signal)
- "LONG C" — Setup C bounce long
Red labels:
- "SHORT A" — Setup A short entry
- "SHORT B DIV" — Setup B divergence short (best signal)
- "SHORT C" — Setup C bounce short
IN THE INDICATOR PANEL (bottom):
- Blue line = Primary timeframe STC
- Orange dots = Higher timeframe STC (optional)
- Green/Red bars = Force Index histogram
- Dashed lines at 25/75 = Entry/Exit zones
- Background shading = Oversold (green) / Overbought (red)
INFO TABLE (top-right corner):
Shows real-time status:
- STC values for both timeframes
- Force Index direction
- Price position vs EMA
- Current trend direction
- Active signal type
═══════════════════════════════════════════════════════════════════
TRADING STRATEGY & RISK MANAGEMENT
ENTRY RULES:
Priority ranking (best to worst):
1st: Setup B (Divergence) — wait for these
2nd: Setup A (Classic) — in confirmed trends only
3rd: Setup C (Bounce) — scalping only
Confirmation checklist before entry:
☑ Signal label appears on chart
☑ TREND in info table matches signal direction
☑ Higher timeframe STC aligned (check orange dots or table)
☑ Force Index confirming (check histogram color)
───────────────────────────────────────────────────────────────────
STOP LOSS PLACEMENT:
Setup A (Classic):
- LONG: Below recent swing low
- SHORT: Above recent swing high
- Typical: 1-2 ATR distance
Setup B (Divergence):
- LONG: Below the divergence low
- SHORT: Above the divergence high
- Typical: 0.5-1.5 ATR distance
Setup C (Bounce):
- LONG: 5-10 pips below EMA50
- SHORT: 5-10 pips above EMA50
- Typical: 0.3-0.8 ATR distance
───────────────────────────────────────────────────────────────────
TAKE PROFIT TARGETS:
Conservative approach:
- Exit when STC reaches opposite level
- LONG: Exit when STC > 75
- SHORT: Exit when STC < 25
Aggressive approach:
- Hold until opposite signal appears
- Trail stop as STC moves in your favor
Partial profits:
- Take 50% at 1:2 risk/reward
- Let remaining 50% run to target
───────────────────────────────────────────────────────────────────
WHAT TO AVOID:
❌ Trading Setup A in sideways/choppy markets
→ Wait for clear trend or use Setup B only
❌ Ignoring higher timeframe STC
→ Always check orange dots align with your direction
❌ Taking signals against the major trend
→ If weekly trend is down, be cautious with longs
❌ Overtrading Setup C
→ Maximum 2-3 bounce trades per session
❌ Trading during low volume periods
→ Force Index becomes unreliable
═══════════════════════════════════════════════════════════════════
ALERTS CONFIGURATION
The indicator includes 8 alert types:
Individual setup alerts:
- "Setup A - LONG" / "Setup A - SHORT"
- "Setup B - DIV LONG" / "Setup B - DIV SHORT" ⭐ recommended
- "Setup C - BOUNCE LONG" / "Setup C - BOUNCE SHORT"
Combined alerts:
- "ANY LONG" — fires on any long signal
- "ANY SHORT" — fires on any short signal
Recommended alert setup:
- Create "Setup B - DIV LONG" and "Setup B - DIV SHORT" alerts
- These are the highest probability signals
- Set "Once Per Bar Close" to avoid false alerts
═══════════════════════════════════════════════════════════════════
VISUALIZATION SETTINGS
Show Labels on Chart:
Toggle on/off the signal labels (green/red)
Disable for cleaner chart once you're familiar with the indicator
Show Higher TF STC:
Toggle the orange dots showing higher timeframe STC
Useful for visual confirmation of multi-timeframe alignment
Info Panel:
Cannot be disabled — always shows current status
Positioned top-right to avoid chart interference
═══════════════════════════════════════════════════════════════════
EXAMPLE TRADE WALKTHROUGH
SETUP B DIVERGENCE LONG EXAMPLE:
1. Market Context:
- Price in downtrend, below 50 EMA
- Multiple lower lows forming
- STC below 25 (oversold)
2. Divergence Formation:
- Price makes new low at $45.20
- Force Index refuses to make new low (higher low forms)
- This indicates selling pressure weakening
3. Signal Trigger:
- STC starts turning up
- Force Index crosses above zero
- Label appears: "LONG B DIV"
4. Trade Execution:
- Entry: $45.50 (current price at signal)
- Stop Loss: $44.80 (below divergence low)
- Target 1: $47.90 (STC reaches 75) — risk/reward 1:3.4
- Target 2: Opposite signal or trail stop
5. Trade Management:
- Price rallies to $47.20
- STC reaches 68 (approaching target zone)
- Take 50% profit, move stop to breakeven
- Exit remaining at $48.10 when STC crosses 75
Result: 3.7R gain
═══════════════════════════════════════════════════════════════════
ADVANCED TIPS
1. MULTI-TIMEFRAME CONFLUENCE
For highest probability trades, wait for:
- Primary TF signal
- Higher TF STC aligned (>25 for longs, <75 for shorts)
- Even higher TF trend in same direction (manual check)
2. VOLUME CONFIRMATION
Watch the Force Index histogram:
- Increasing bar size = Strengthening momentum
- Decreasing bar size = Weakening momentum
- Use this to gauge signal strength
3. AVOID THESE MARKET CONDITIONS
- Major news events (Force Index becomes erratic)
- Market open first 30 minutes (volatility spikes)
- Low liquidity instruments (Force Index unreliable)
- Extreme trending days (wait for pullbacks)
4. COMBINE WITH SUPPORT/RESISTANCE
Best signals occur near:
- Key horizontal levels
- Fibonacci retracements
- Previous day's high/low
- Psychological round numbers
5. SESSION AWARENESS
- Asia session: Use lower timeframes, Setup C works well
- London session: Setup A and B both effective
- New York session: All setups work, highest volume
═══════════════════════════════════════════════════════════════════
INDICATOR WINDOWS LAYOUT
MAIN CHART:
- Price action
- 50 EMA (green/red)
- Signal labels
- Info panel
INDICATOR WINDOW:
- STC oscillator (blue line, 0-100 scale)
- Higher TF STC (orange dots, optional)
- Force Index histogram (green/red bars)
- Reference levels (25, 50, 75)
- Background zones (green oversold, red overbought)
═══════════════════════════════════════════════════════════════════
PERFORMANCE OPTIMIZATION
For best results:
Backtesting:
- Test on your specific instrument and timeframe
- Adjust STC parameters if win rate < 55%
- Record which setup works best for your market
Position Sizing:
- Risk 1-2% per trade
- Setup B can use 2% risk (higher win rate)
- Setup C should use 1% risk (lower win rate)
Trade Frequency:
- Setup B: 2-5 signals per week (be patient)
- Setup A: 5-10 signals per week
- Setup C: 10+ signals per week (scalping)
═══════════════════════════════════════════════════════════════════
CREDITS & REFERENCES
This indicator builds upon established technical analysis concepts:
Schaff Trend Cycle:
- Developed by Doug Schaff (1996)
- Original concept published in Technical Analysis of Stocks & Commodities
- Implementation based on standard STC formula
Force Index:
- Developed by Dr. Alexander Elder
- Described in "Trading for a Living" (1993)
- Classic volume-momentum indicator
The multi-timeframe integration, three-setup system, and specific
entry conditions are original contributions of this indicator.
═══════════════════════════════════════════════════════════════════
DISCLAIMER
This indicator is a technical analysis tool and does not guarantee profits.
Past performance is not indicative of future results. Always:
- Use proper risk management
- Test on demo account first
- Combine with fundamental analysis
- Never risk more than you can afford to lose
═══════════════════════════════════════════════════════════════════
SUPPORT & QUESTIONS
If you find this indicator helpful, please:
- Leave a like and comment
- Share your feedback and results
- Report any bugs or issues
For questions about usage or optimization for specific markets,
feel free to comment below.
═════════════════════════════════════════════════════════════

Livermore's Pyramiding Trading - 3Commas [SwissAlgo]
📊 J. LIVERMORE'S PYRAMIDING TRADING - 3Commas Integrated
A Trading Approach Inspired by Jesse Livermore's Position Building Principles
━━━━━━━━━━━━━━━━━━━━━━━━━━━━━━━━━━━━━━━━━━━
DISCLAIMER
This indicator is an educational tool based on historical trading principles. Past performance is not indicative of future results. Trading involves substantial risk of loss. Only trade with capital you can afford to lose. You are responsible for all trading decisions.
━━━━━━━━━━━━━━━━━━━━━━━━━━━━━━━━━━━━━━━━━━━
📚 WHO WAS JESSE LIVERMORE?
Jesse Livermore (1877-1940) was one of the greatest traders in history.
His core insight: "Most traders do everything backward."
♦ "They deploy all capital at once" → Livermore entered with a small fraction of his capital (he started with a 'test position' to validate his trade idea and waited for market confirmation to deploy more, building positions in steps = "pyramiding")
♦ "They average down" (DCA) → Livermore added to trades showing good results only, and never to losing trades, as the trend kept aligning with his trade idea
♦ "They use arbitrary % stops" → Livermore exited when structure appeared broken (he trailed his stop loss to try to protect unrealized profit - if any)
♦ "They take profits too early or set arbitrary TP%" → Livermore let trades showing positive results run until proven wrong (trial take profit)
💬 "I always made money when I was sure I was right before I began. What beat me was not having enough brains to stick to my own game."
— Jesse Livermore
This indicator tries to translate his principles into a SYSTEMATIC FRAMEWORK :
BO = Base Order (first order, base of the pyramid)
PO = Pyramid Orders (additional layers of capital deployed as long as the 'tape' does not invalidate the trade idea)
♦ Test First (BO - 20%) - Small entry to test your idea. If wrong, lose small. If right, can consider pyramiding into strength.
♦ Build Position Size (PO1-3 - 80%) - Add only as trend unfolds favorably (the indicator uses specific Fibonacci levels to track milestones - 0.618, 1.0, 1.272 - and looks for strong confluence among price, volume, trend, momentum, break of resistance/support levels to suggest and trigger actions: entries, exit)
♦ Attempt to Protect Capital - Dynamic stops: the indicator trails the stop loss, to try to protect potential gains from previous steps (if any)
♦ Discipline - Trades fire only when ALL conditions align
━━━━━━━━━━━━━━━━━━━━━━━━━━━━━━━━━━━━━━━━━━━
🎯 INDICATOR FEATURES
You map 3 points on the chart → The indicator generates a systematic trading plan structure based on your wave analysis.
✓ Auto-detects trade direction: Uptrend wave (A➚B➘C) = Long signals | Downtrend wave (A➘B➚C) = Short signals
✓ Entry/exit prices: BO, PO1, PO2, PO3, and dynamic EXIT (trailing stop)
✓ Real-time condition monitoring: Live ✓/✗ checks for each order (price closes + volume + trend + pivot breaks + candle quality + sequence)
✓ Visual trade execution: Green labels mark entries (BO/PO1/PO2/PO3), red labels mark EXIT
✓ Optional 3Commas automation: JSON webhooks for hands-free execution via Signal Bots
⏰ Recommended Timeframes: 1H, 4H, Daily
(Lower timeframes like 15m/5m produce excessive noise and false signals)
💬 "Watch the market leaders, the stocks that have led the charge. That is where the action is and where the money is made."
— Jesse Livermore
━━━━━━━━━━━━━━━━━━━━━━━━━━━━━━━━━━━━━━━━━━━
⚙️ SETUP IN 3 STEPS
🟡 STEP 1: Map Your Wave (Points A → B → C)
Identify a completed wave pattern:
For LONGS:
♦ Point A = Swing low (wave start)
♦ Point B = Swing high (impulse end)
♦ Point C = Pullback low (retrace end - where next wave may begin)
For SHORTS:
♦ Point A = Swing high (wave start)
♦ Point B = Swing low (impulse end)
♦ Point C = Pullback high (retrace end - where next wave may begin)
How to set points:
Settings → Enter dates manually OR drag the vertical lines directly on the chart (easier - just click and drag the pre-mapped A/B/C lines)
Requirements (auto-validated by code):
✓ All dates must be in the past (Point C = completed retrace, not forming)
✓ Clear impulse A→B (minimum 5% move)
✓ Clear retrace B→C (minimum 3% pullback)
───────────────────────────────────────────
🟡 STEP 2: Set Budget & Allocation
Settings → "TRADE PARAMETERS"
♦ Total Budget: $10,000 (example - capital for THIS trade only, not your entire account)
♦ Allocation (must total 100%):
BO = 20% ($2,000) - test position
PO1 = 25% ($2,500) @ Fib 0.618
PO2 = 30% ($3,000) @ Fib 1.0
PO3 = 25% ($2,500) @ Fib 1.272
💬 "It was never my thinking that made big money for me. It was always my sitting. Men who can both be right and sit tight are uncommon."
— Jesse Livermore
───────────────────────────────────────────
🟡 STEP 3: Monitor Your Trade Plan Table
The table (top-right corner) has 4 sections that guide your execution:
BUDGET DEPLOYMENT
♦ Trigger prices for each order (BO auto-calculated at 0.5 Fib between B-C)
♦ Dollar amount per entry
♦ Fibonacci level assigned to each PO
ENTRY/EXIT CONDITIONS
Each column (BO, PO1, PO2, PO3) shows live status (✓ or ✗) for:
♦ Price: 2 consecutive closes (BO) | 3 consecutive closes (POs)
♦ Volume: OBV directional alignment OR volume spike above average
♦ Trend: Normal or Strong Bull/Bear (no entries in Uncertain trend)
♦ Pivot: Nearest resistance (longs) or support (shorts) broken
♦ Clean Candle: Momentum without reversal wicks <30% (POs only)
♦ Sequence: Prior order must have fired first (POs only - no skipping levels)
TRIGGERED?
Shows execution status for each order (✓ = fired, ✗ = waiting)
If using 3Commas: ✓ confirms JSON alert was sent to your bot for real execution
VALIDATIONS
✓ Green = All checks passed, setup is valid
⚠️ Yellow = Warning (e.g., budget doesn't equal 100%, deep retrace)
✗ Red = Error (e.g., dates in wrong order, invalid wave structure)
⚠️ Wait for ALL ✓✓✓✓✓ (or ✓✓✓✓✓✓) to align in a column before that order fires at bar close
💬 "The game of speculation is the most uniformly fascinating game in the world. But it is not a game for the stupid, the mentally lazy, the person of inferior emotional balance, or the get-rich-quick adventurer."
— Jesse Livermore
━━━━━━━━━━━━━━━━━━━━━━━━━━━━━━━━━━━━━━━━━━━
📊 CHART VISUALS - READING THE INDICATOR
Fibonacci Extension Lines
After mapping A-B-C, horizontal lines extend to the right:
♦ Solid green/red lines = Active PO entry levels (0.618, 1.0, 1.272)
♦ Dotted gray lines = Reference Fib levels used for exit tracking (2.0, 2.618, 3.0, etc.)
♦ Labels on right = Show level and price: "Fib 0.618 / $67,324 "
Entry/Exit Price Lines
♦ Thick green line (longs) / red line (shorts) = BO entry price with direction label
♦ Dashed red line = Current EXIT price (your trailing stop loss - appears after BO fires and moves as price extends)
Trade Execution Labels
Visual confirmation when orders fire on the chart:
♦ Green labels (below/above candles) = BO, PO1, PO2, PO3 entries executed
♦ Red label = EXIT triggered (position closed)
Trend Strength Indicator (EMA Line)
The thick colored line shows real-time trend status:
♦ Bright lime = Strong bullish trend
♦ Light green = Normal bullish trend
♦ Bright red = Strong bearish trend
♦ Light red = Normal bearish trend
♦ Gray = Uncertain/weak trend (no entries fire in this state)
Entries require at least Normal trend strength aligned with your trade direction.
💬 "I never argue with the tape. Getting sore at the market doesn't get you anywhere."
— Jesse Livermore
━━━━━━━━━━━━━━━━━━━━━━━━━━━━━━━━━━━━━━━━━━━
🔧 ENTRY LOGIC - TECHNICAL DETAILS
💬 "The big money was never made in the buying or the selling. The big money was made in the waiting."
— Jesse Livermore
───────────────────────────────────────────
🟢 BASE ORDER (BO) - TEST POSITION
BO Price Calculation
Auto-calculated at the 0.5 Fibonacci retracement between Point B and Point C
Formula: (Price B + Price C) / 2
Why this level?
♦ Midpoint between impulse end (B) and retrace end (C)
♦ Breakout above/below suggests retrace may be complete
♦ Designed to help position BO below all Fib extensions (to control sequence issues)
───────────────────────────────────────────
BO Entry Conditions - ALL 5 Must Align:
1️⃣ PRICE: 2 Consecutive Closes Beyond BO
♦ Longs: close > BO AND close > BO
♦ Shorts: close < BO AND close < BO
♦ Why: Designed to confirm breakout commitment and filter fakeouts
2️⃣ TREND: Normal OR Strong Trend Aligned
♦ Detection: 18-period EMA + ADX/DMI + higher timeframe slope
♦ States: Strong Bull/Bear (ADX>30), Normal Bull/Bear (price vs EMA), Uncertain
♦ Confirmation: Requires 3 consecutive bars in the same state (to reduce flip-flop)
♦ BO accepts: Normal OR Strong (you're testing early, basic alignment sufficient)
3️⃣ PIVOT: Nearest Resistance/Support Broken
♦ Storage: 60 most recent pivot highs/lows (dynamic lookback per timeframe)
♦ Longs: Nearest pivot HIGH above BO → must break with 2 closes
♦ Shorts: Nearest pivot LOW below BO → must break with 2 closes
♦ Price Discovery: If no pivot exists beyond BO = auto-pass
♦ Why: Aims to confirm momentum has overcome previous rejection zones
4️⃣ VOLUME: OBV Aligned OR Spike
♦ Directional OBV: OBV > 20-EMA (longs) OR OBV < 20-EMA (shorts)
♦ OR Volume Spike: Current volume > 20-period SMA
♦ Why: Checks for institutional participation signals
5️⃣ VALIDATIONS: Setup Valid (✅)
♦ Dates valid (A < B < C, all in past)
♦ Wave structure valid (min 5% impulse, min 3% retrace)
♦ Budget allocation = 100%
♦ Prices detected at all points
⚠️ BO fires once per bar close. Flag set permanently until trade resets.
───────────────────────────────────────────
🔺 PYRAMID ORDERS (PO1-3) - PYRAMIDING INTO STRENGTH
💬 "Never buy a stock because it has had a big decline from its previous high. The big money was never made in the stock market by buying on declines."
— Jesse Livermore
PO Price Calculation
Fixed Fibonacci extensions from Point C:
Formula: Price C ± (Impulse Range × Fib Level)
Where: Impulse Range = |Price B - Price A|
Default Levels:
♦ PO1 @ Fib 0.618 (Golden Ratio)
♦ PO2 @ Fib 1.000 (Full impulse repeat)
♦ PO3 @ Fib 1.272 (Fibonacci sequence extension)
───────────────────────────────────────────
PO Entry Conditions - ALL 6 Must Align (STRICTER):
1️⃣ PRICE: 3 Consecutive Closes Beyond PO
♦ Longs: close > PO AND close > PO AND close > PO
♦ Shorts: close < PO AND close < PO AND close < PO
♦ Why: Higher conviction needed when adding capital (3 vs 2 closes for BO)
2️⃣ TREND: Same as BO
Normal OR Strong trend must remain aligned with trade direction
3️⃣ PIVOT: Per-Level Pivot Break
♦ Each PO checks its OWN nearest pivot (not shared with BO)
♦ Same 2-close break requirement
♦ PO3 Exception: Price discovery allowed (no pivot required if already profitable)
4️⃣ VOLUME: Same as BO
Sustained confirmation required (not weakening)
5️⃣ CLEAN CANDLE: <30% Reversal Wick (NEW)
♦ Filter: Uses ATR(14) - candles < ATR auto-pass (consolidation noise)
♦ Longs: Upper wick < 30% of candle range (no rejection at top)
♦ Shorts: Lower wick < 30% of candle range (no rejection at bottom)
♦ Why: Don't pyramid into weakness/rejection - only add on clean momentum
♦ Not checked for BO: Test position tolerates some wick risk
6️⃣ SEQUENCE: Prior Order Fired
♦ PO1 requires: BO fired
♦ PO2 requires: PO1 fired
♦ PO3 requires: PO2 fired
♦ Why: No skipping levels - disciplined building only
───────────────────────────────────────────
⚙️ KEY DIFFERENCE:
BO (20% capital) = Lighter requirements, testing your idea early
POs (80% capital) = Stricter requirements, adding only to confirmed winners
♦ BO: 2 closes | POs: 3 closes
♦ BO: No candle check | POs: Clean candle required
♦ BO: Independent | POs: Sequential (must follow order)
♦ BO: No price discovery | PO3: Allows price discovery when profitable
💬 "Profits always take care of themselves, but losses never do. The speculator has to ensure himself against considerable losses by taking the first small loss."
— Jesse Livermore
━━━━━━━━━━━━━━━━━━━━━━━━━━━━━━━━━━━━━━━━━━━
🚪 EXIT LOGIC - TECHNICAL DETAILS
🔴 EXIT PHILOSOPHY
The indicator uses TWO INDEPENDENT EXIT TRIGGERS (whichever fires first):
1) Structural Breakdown
Price breaks through the EXIT level with confirmation
2) Trend Reversal
Trend flips against your position AND price breaks EXIT level
Why two methods?
♦ Structure = price-based protection (hard stop)
♦ Trend = momentum-based exit (early warning when market character changes)
♦ Combined: Exit either when proven wrong (structure) or when conditions no longer favor your direction (trend)
───────────────────────────────────────────
🔴 EXIT PRICE CALCULATION
The EXIT price (your stop loss) adjusts dynamically based on position size:
BEFORE PO3 Fires (Fixed Stops):
♦ BO only = Stop at Point C (small position, tight stop near entry)
♦ PO1 fired = Stop at Fib 0.5 (moved to breakeven zone)
♦ PO2 fired = Stop at Fib 0.786 (protecting partial profits)
AFTER PO3 Fires (Trailing Stops):
♦ Tracking: Monitors the highest Fib reached (longs) or the lowest Fib reached (shorts)
♦ Placement: EXIT moves 1-2 Fib levels below the highest (longs) or above the lowest (shorts)
♦ Example: Price reaches Fib 2.618 → EXIT trails up to Fib 2.0
♦ Purpose: Designed to protect accumulated profits while allowing room for normal pullbacks
💬 "It never was my thinking that made the big money for me. It was always my sitting. Men who can both be right and sit tight are uncommon."
— Jesse Livermore
───────────────────────────────────────────
🔴 EXIT CONDITIONS
Exit Speed (Based on Risk Exposure):
♦ Full position (PO3 fired) = 1 close required (fast exit - more capital at risk)
♦ Partial position (BO/PO1/PO2 only) = 2 closes required (confirmation - less urgency)
METHOD 1: Structural Breakdown
Price violates the EXIT level with clean momentum:
For Longs:
♦ Price closes BELOW EXIT level (1 or 2 closes depending on position size)
♦ Clean candle required (lower wick < 50% of range - no false breakdown)
For Shorts:
♦ Price closes ABOVE EXIT level (1 or 2 closes depending on position size)
♦ Clean candle required (upper wick < 50% of range - no false breakout)
Why clean candle check?
Designed to reduce exits on wicks/fakeouts. If there's a large reversal wick (>50%), it suggests buyers/sellers are defending the level - not a true breakdown.
METHOD 2: Trend Reversal
Market character shifts against your position:
For Longs:
♦ Trend shifts from Bull → Normal Bear OR Strong Bear
♦ AND price breaks below EXIT level (same close requirements)
For Shorts:
♦ Trend shifts from Bear → Normal Bull OR Strong Bull
♦ AND price breaks above EXIT level (same close requirements)
Why this matters?
♦ Proactive exit before structural stop is hit
♦ If the trend that confirmed your entries reverses, the setup is invalidated
♦ Livermore principle: Exit when market proves you wrong, don't wait for max pain
───────────────────────────────────────────
⚠️ EXIT BEHAVIOR
♦ Fires once per bar close (same as entries)
♦ Resets all tracking after exit (ready for fresh trade setup)
♦ Clears flags: boSignalFired, po1/po2/po3SignalFired, highestFib/lowestFib tracking
♦ If using 3Commas: Sends exit_long or exit_short JSON (market order closes 100% position)
💬 "I never argue with the tape. Getting sore at the market doesn't get you anywhere."
— Jesse Livermore
━━━━━━━━━━━━━━━━━━━━━━━━━━━━━━━━━━━━━━━━━━━
🤖 3COMMAS AUTOMATION (OPTIONAL)
💬 "There is the plain fool, who does the wrong thing at all times everywhere, but there is also the Wall Street fool, who thinks he must trade all the time."
— Jesse Livermore
Automation designed to help remove emotion and support disciplined execution.
───────────────────────────────────────────
⚡ QUICK SETUP IN 5 STEPS
STEP 1: Create Your Signal Bots
You need 2 SEPARATE BOTS (one for Longs, one for Shorts):
Go to 3Commas → Bots → Create Bot → Select "Signal Bot"
Basic Settings:
♦ Bot Name: "Livermore Long - " (example: "Livermore Long - BTCUSDT")
♦ Exchange: Your connected exchange
♦ Trading Pair: Must match TradingView chart exactly
♦ Strategy: Custom Signal
♦ Direction: LONG (for first bot) or SHORT (for second bot)
♦ Max Active Deals: 1
⚠️ CRITICAL SETTINGS:
Entry Orders:
♦ Toggle ON: "Entry Orders"
♦ Volume per Order: "Send in webhook, quote"
♦ Why: This lets the indicator control exact $ amounts per order (BO=$2K, PO1=$2.5K, etc.)
♦ If you skip this: Orders will use wrong sizes and break your allocation plan
Exit Orders:
♦ Toggle ON: "Exit Orders"
♦ Volume per Order: "100 Position %"
♦ Why: Closes your entire position when EXIT signal fires
♦ Toggle OFF: "Take Profit" (managed by indicator)
♦ Toggle OFF: "Stop Loss" (managed by indicator)
Click "Start Bot" for both Long and Short bots.
───────────────────────────────────────────
STEP 2: Get Your Bot Credentials
For EACH BOT (Long and Short):
♦ Open the bot → Click "Orders" tab
♦ Scroll down to "Webhook Messages" section
♦ Copy these 3 values:
bot_uuid (long string like: a362cbcf-7e68-4379-a83d-ae6e47dba656)
secret (very long token starting with: eyJhbGciOiJ...)
webhook URL (refer to 3commas to get exact webhook - signal bots)
Note: The secret is usually the same for both bots, but the bot_uuid is different.
───────────────────────────────────────────
STEP 3: Enter Credentials in Indicator
Back in TradingView:
♦ Open indicator Settings
♦ Find section: "1️⃣ INTEGRATE 3COMMAS"
♦ Paste:
Long = Your Long bot UUID
Short = Your Short bot UUID
Secret = Your secret token (same for both)
♦ Click "OK"
The indicator now has everything needed to build JSON payloads.
───────────────────────────────────────────
STEP 4: Create TradingView Alert
This alert bridges TradingView → 3Commas. ONE ALERT HANDLES ALL SIGNALS (BO, PO1, PO2, PO3, EXIT).
How to create:
♦ Right-click chart → "Add Alert" (or click clock icon)
♦ Condition: Select this indicator from dropdown
♦ Trigger: "Any alert() function call"
♦ Alert Name: "Livermore Pyramiding - "
♦ Message: Leave default (indicator sends its own JSON)
♦ Webhook URL: Paste your 3Commas webhook URL from Step 2
♦ ⚠️ Alert Frequency: "Once Per Bar Close" (CRITICAL - controls duplicate orders)
♦ Expiration: Open-ended (or set specific date)
♦ Click "Create"
───────────────────────────────────────────
STEP 5: Test Before Going Live
🧪 NEVER TEST WITH REAL CAPITAL FIRST. Use one of these methods:
Test 1: Check Bot Status
♦ 3Commas → Bots → Both bots show "Active" (green)
♦ Click into each bot → Orders tab → Should say "Waiting for signal"
Test 2: Verify Alert Active
♦ TradingView → Alerts panel (bell icon)
♦ Your alert should show "Active" status
Test 3: Paper Trade / Tiny Position
♦ Use 3Commas paper mode if available, OR
♦ Set Total Budget to $10-50 for first real test
♦ Map a wave that's about to trigger
♦ Watch if orders actually appear on 3Commas
Test 4: Check JSON Format
♦ When alert fires → TradingView Alerts → Click your alert
♦ Look at "History" or "Log"
♦ Verify JSON has: bot_uuid, secret, action, price, amount
───────────────────────────────────────────
🛠️ COMMON ISSUES & SOLUTIONS
✗ Problem: Orders not appearing on 3Commas
Possible causes:
♦ Wrong webhook URL → Must be exact 3Commas URL (check for typos)
♦ Bot paused → Check bot status must be "Active" (green)
♦ Wrong bot UUID → Verify you copied Long UUID for longs, Short UUID for shorts
♦ Secret mismatch → Double-check secret is correct
♦ Exchange API issues → Verify exchange connection in 3Commas settings
How to debug:
♦ 3Commas → Your Signal Bot → Orders tab
♦ Look for "Rejected Signals" section
♦ Should show error messages if webhook failed
───────────────────────────────────────────
✗ Problem: Orders executing at wrong prices
Possible causes:
♦ Limit order not filled → Price gapped through your level before order filled
♦ Slippage on exits → Exits use market orders (intentional - speed over exact price)
♦ Exchange minimums → Some exchanges have minimum order sizes
Solution:
♦ Entries use limit orders (wait for exact price - may not fill if price gaps)
♦ Exits use market orders (prioritize fast execution when structure breaks)
♦ This is INTENTIONAL DESIGN following Livermore's principle: exit when proven wrong
───────────────────────────────────────────
✗ Problem: PO orders firing out of sequence or skipping
Possible causes:
♦ Alert not set to "Once Per Bar Close" → Change alert frequency setting
♦ Multiple alerts running → Delete old/duplicate alerts for this indicator
♦ Conditions changed mid-bar → Indicator only fires at bar close (protective feature)
Solution:
♦ Keep only 1 active alert per indicator instance
♦ Always use "Once Per Bar Close" frequency
♦ Wait for full bar to close before signals can fire
───────────────────────────────────────────
✗ Problem: Bot not closing position on EXIT
Possible causes:
♦ Exit order setting wrong → Check bot settings
♦ Wrong JSON action → Should be "exit_long" or "exit_short"
♦ No position open → Can't close what doesn't exist
Solution:
♦ Verify: Bot Settings → Exit Orders → Volume per Order = "100 Position %"
♦ Check alert history for correct JSON payload
♦ If stuck: Manually close position in 3Commas, then fix settings
♦ Delete and recreate alert if JSON format is wrong
───────────────────────────────────────────
🔒 SECURITY BEST PRACTICES
♦ Never share bot UUID or Secret - Treat them like passwords
♦ Use restricted API keys - Limit to specific pairs, disable withdrawals
♦ Start small - Test with $10-50 first, scale up only after success
♦ Monitor first trades - Don't set-and-forget immediately
♦ Delete old alerts - If you change A/B/C points, delete old alert and create new one
───────────────────────────────────────────
📊 PREFER MANUAL TRADING?
Skip 3Commas entirely and use the indicator for planning only:
♦ Watch Trade Plan table for ✓✓✓✓✓ alignment
♦ Manually place limit orders at displayed prices
♦ Manually move stop loss as EXIT price updates
♦ Manually close when EXIT signal fires
Benefits: Full control, no API concerns, can override based on context
Drawbacks: Must watch chart constantly, emotions can interfere, may miss signals
───────────────────────────────────────────
✅ FINAL CHECKLIST BEFORE LIVE TRADING
✓ Both Signal Bots created (Long + Short)
✓ Entry Orders: Volume = "Send in webhook, quote"
✓ Exit Orders: Volume = "100 Position %"
✓ Take Profit and Stop Loss disabled in bots
✓ Bot UUIDs and Secret entered in indicator
✓ TradingView alert created with correct webhook
✓ Alert frequency = "Once Per Bar Close"
✓ Alert status shows "Active"
✓ Tested with small amounts successfully
✓ Trade Plan table shows ✅ (no validation errors)
✓ Understand your risk per trade
Once all checked: You're ready for automated pyramiding execution.
━━━━━━━━━━━━━━━━━━━━━━━━━━━━━━━━━━━━━━━━━━━
💡 KEY REMINDERS - BEFORE YOU TRADE
💬 "The speculator's chief enemies are always boring from within. It is inseparable from human nature to hope and to fear."
— Jesse Livermore
───────────────────────────────────────────
⚠️ COMMON MISTAKES (AVOID THESE)
Mapping Incomplete Waves
♦ Point C must be in the PAST (completed retrace, not currently forming)
♦ Don't map a wave that's still developing - wait for confirmation
♦ Minimum requirements: 5% impulse (A→B), 3% retrace (B→C)
Ignoring Validation Warnings
♦ Never create alerts when status shows ✗ (red) or ⚠️ (yellow)
♦ Fix all errors first: dates in order, budget = 100%, valid wave structure
♦ Common issues: dates in future, Point C above B (longs) or below B (shorts)
Premature Manual Entries
♦ Don't enter just because price touched the level
♦ Wait for ALL ✓✓✓✓✓ (or ✓✓✓✓✓✓) to align in Trade Plan table
♦ Patience pays - partial confluence = partial edge = higher risk of losing trades
Wrong Timeframe Selection
♦ Avoid: 15m, 5m, 1m (too much noise, false signals)
♦ Use: 1H, 4H, Daily (cleaner structure, better confluence)
♦ Lower timeframes require faster decisions and produce more whipsaws
Over-Risking Capital
♦ Trade budget ≠ Account size
♦ Never risk capital you can't afford to lose
♦ One bad trade should NOT destroy your account
───────────────────────────────────────────
✅ LIVERMORE PRINCIPLES IN ACTION
Confirmation > Prediction
♦ Don't predict where price will go
♦ Wait for price to INDICATE direction via pivots + volume + trend
♦ Test first (BO 20%), build only when confirmed (POs 80%)
💬 "A man must believe in himself and his judgment if he expects to make a living at this game."
Pyramid on Strength, Never Weakness
♦ Add only when: 3 closes + clean candles + volume + pivot breaks
♦ Never average down (DCA into losers)
♦ If BO wrong, take small loss fast - don't hope and add more
💬 "Never buy a stock because it has had a big decline from its previous high."
Respect Market Structure
♦ Pivots = where smart money previously acted (support/resistance)
♦ Breaking them = momentum overcoming barriers
♦ Entering before pivot break = entering into known rejection zones
Trend is Your Friend
♦ Never pyramid against the trend
♦ If trend shifts to Uncertain or reverses → no new entries
♦ Exit when trend proves you wrong (don't fight it)
💬 "I never argue with the tape. Getting sore at the market doesn't get you anywhere."
Discipline > Emotion
♦ Can't "almost" have all conditions met
♦ Either 100% aligned (all ✓) or you wait
♦ No exceptions, no "this time is different"
♦ Automation designed to help remove emotion - consider using 3Commas
💬 "It never was my thinking that made the big money for me. It always was my sitting."
───────────────────────────────────────────
🎯 FINAL THOUGHT
This indicator is a SYSTEMATIC FRAMEWORK, not a magic solution. It translates Livermore's century-old principles into actionable rules:
♦ Test small, build big
♦ Add to winners, cut losers fast
♦ Let structure guide exits
♦ Stay disciplined when emotions scream
The market will test your patience, discipline, and conviction. The indicator aims to reduce guesswork - but YOU still need to:
♦ Find valid wave structures
♦ Choose appropriate market conditions
♦ Size positions properly
♦ Accept losses as part of the game
💬 "The game of speculation is the most uniformly fascinating game in the world. But it is not a game for the stupid, the mentally lazy, the person of inferior emotional balance, or the get-rich-quick adventurer."
— Jesse Livermore

52SIGNAL RECIPE Coinbase Institutional Smart Money DetectorCoinbase Institutional Smart Money Detector
◆ Overview
Coinbase Institutional Smart Money Detector is an innovative indicator that detects the buying and selling movements of institutional investors through Coinbase Prime in real-time. This powerful tool tracks the flow of funds from large institutions to provide valuable signals before significant market direction changes occur. It can be applied to Bitcoin charts on any exchange, allowing traders to follow the "smart money" movements of institutions anytime, anywhere.
The unique strength of this indicator lies in its comprehensive assessment of institutional investors' consecutive trading behaviors, volume patterns, and trend strength by analyzing Coinbase data in real-time. By providing clear visual representation of institutional fund flow data that is difficult for ordinary traders to access, you gain the opportunity to move alongside the big players in the market.
─────────────────────────────────────
◆ Key Features
• Coinbase Prime Data Analysis: Tracks institutional movements in real-time by analyzing data from Coinbase Prime, an institutional-only service
• Real-time Institutional Fund Flow Monitoring: Immediately detects large institutions' spot buying/selling activities, allowing positioning ahead of the market
• Universal Exchange Compatibility: Applicable to Bitcoin charts on any exchange, enabling use on your preferred trading platform
• Institutional Continuity Analysis: Identifies continuous institutional activity by tracking consecutive buying/selling patterns
• Smart Volume Analysis: Detects increased volume compared to averages and analyzes key trading time periods
• Trend Strength Measurement: Quantifies and displays the strength of upward/downward trends by analyzing candle patterns
• Intuitive Visualization: Clearly marks institutional activity points on charts through bar coloring and labels
• Real-time Strength Display: Calculates and displays current trend strength in a table in real-time
• Customizable Settings: Allows customization of key parameters to match your trading style
─────────────────────────────────────
◆ Understanding Signal Types
■ Institutional Buy Signal
• Definition: Occurs when institutional investors show consecutive buying activity through Coinbase Prime, accompanied by increased volume and strong upward trend
• Visual Representation: Translucent blue bar coloring and "Institution Buying Detected!" label on the candle where the buy signal occurs
• Market Interpretation: Indicates that institutional investors are actively buying spot Bitcoin, which is likely to lead to price increases
• Signal Strength Factors:
▶ Consecutive price increase patterns
▶ Above-average volume
▶ Strong upward trend strength measurement
▶ Significant price movement
■ Institutional Sell Signal
• Definition: Occurs when institutional investors show consecutive selling activity through Coinbase Prime, accompanied by increased volume and strong downward trend
• Visual Representation: Translucent pink bar coloring and "Institution Selling Detected!" label on the candle where the sell signal occurs
• Market Interpretation: Indicates that institutional investors are actively selling spot Bitcoin, which is likely to lead to price decreases
• Signal Strength Factors:
▶ Consecutive price decrease patterns
▶ Above-average volume
▶ Strong downward trend strength measurement
▶ Significant price movement
─────────────────────────────────────
◆ Understanding Trend Strength
■ Trend Strength Measurement Method
• Definition: Measures trend strength by analyzing the ratio of up/down candles over a recent period
• Visual Representation: Displayed in the table as "BULL STRENGTH" or "BEAR STRENGTH" with percentage value and "STRONG" or "WEAK" status
• Strength Threshold: Strong/weak determination according to user-configurable threshold
• Calculation Method:
▶ Upward trend strength = (Number of upward candles) / (Total analysis period)
▶ Downward trend strength = (Number of downward candles) / (Total analysis period)
▶ Displayed as "STRONG" when strength is above threshold, "WEAK" when below
■ Utilizing Trend Strength
• Signal Filtering: Generates signals only when trend strength is strong, reducing false signals
• Trend Confirmation: Evaluates the health and sustainability of the current market trend
• Entry/Exit Decisions: Consider entering in strong trends and exiting when trends weaken
• Risk Management: Develop strategies to reduce position size in weak trends and increase in strong trends
─────────────────────────────────────
◆ Practical Trading Applications
■ Institutional Buy Signal Strategy
• Trend Reversal Scenario:
▶ Setup: Strong institutional buy signal during a downtrend
▶ Entry: Buy after signal confirmation in the next candle
▶ Stop Loss: Below the low of the signal candle
▶ Take Profit: When reaching previous major resistance or when trend strength weakens
• Trend Continuation Scenario:
▶ Setup: Institutional buy signal after correction in an uptrend
▶ Entry: Buy after signal confirmation
▶ Stop Loss: Below recent major low
▶ Take Profit: Gradually take profits considering trend strength
■ Institutional Sell Signal Strategy
• Trend Reversal Scenario:
▶ Setup: Strong institutional sell signal during an uptrend
▶ Entry: Sell after signal confirmation in the next candle
▶ Stop Loss: Above the high of the signal candle
▶ Take Profit: When reaching previous major support or when trend strength weakens
• Trend Continuation Scenario:
▶ Setup: Institutional sell signal after bounce in a downtrend
▶ Entry: Sell after signal confirmation
▶ Stop Loss: Above recent major high
▶ Take Profit: Gradually take profits considering trend strength
■ Multi-Timeframe Approach
• Higher Timeframe Direction Confirmation:
▶ Check institutional signals and trend strength on daily/4-hour charts
▶ Use for setting main trading direction
• Lower Timeframe Entry Point Finding:
▶ Wait for lower timeframe signals that align with higher timeframe direction
▶ Use for capturing precise entry points
• Cross-Timeframe Signal Alignment:
▶ Signal strength increases when signals occur in the same direction across multiple timeframes
▶ Capture high-probability trading opportunities
─────────────────────────────────────
◆ Indicator Settings Guide
■ Main Setting Parameters
• Institutional Continuity Period:
▶ Purpose: Sets the period to check institutional consecutive buying/selling activity
▶ Lower value: Generates more signals, increases responsiveness
▶ Higher value: Reduces number of signals, increases reliability
• Trend Strength Threshold:
▶ Purpose: Sets the minimum threshold for determining strong trends
▶ Lower value: More signals, less filtering
▶ Higher value: Generates signals only in stronger trends, higher filtering
─────────────────────────────────────
◆ Synergy with Other Indicators
• Support/Resistance Levels:
▶ Institutional signals occurring at key support/resistance levels have higher probability
▶ Combination of key technical analysis levels and institutional activity provides powerful signals
• Moving Averages:
▶ Pay attention to institutional signals near key moving averages (50MA, 200MA)
▶ Strong trend change possibility when moving average crossovers coincide with institutional signals
• RSI/Momentum Indicators:
▶ Institutional buy signals in oversold conditions increase reversal probability
▶ Institutional sell signals in overbought conditions increase reversal probability
• Volume Profile:
▶ Institutional signals at high volume nodes confirm important price levels
▶ Institutional activity in key trading areas greatly impacts price direction
• Market Structure:
▶ Institutional signals near key market structures (higher highs/lows, lower highs/lows) suggest structural changes
▶ Coincidence of market structure changes and institutional activity indicates important trend turning points
─────────────────────────────────────
◆ Conclusion
Coinbase Institutional Smart Money Detector provides traders with valuable insights by tracking spot Bitcoin trading activities of institutional investors through Coinbase Prime in real-time. Because it can be applied to Bitcoin charts on any exchange, you can utilize it immediately on your preferred trading platform.
The core value of this indicator is providing intuitive visualization of institutional fund flow data that is difficult for ordinary traders to access. By comprehensively analyzing consecutive price movements, volume increases, and trend strength to capture institutional activity, you gain the opportunity to move alongside the big players in the market.
Clear buy/sell signals based on Coinbase Prime data and real-time trend strength measurements help traders quickly grasp market conditions and make strategic decisions. By integrating this powerful tool into your trading strategy, secure a competitive edge to understand where the market's smart money is flowing and position accordingly.
─────────────────────────────────────
※ Disclaimer: Like all trading tools, the Institutional Smart Money Detector should be used as a supplementary indicator and not relied upon exclusively for trading decisions. Past patterns of institutional behavior may not guarantee future market movements. Always employ appropriate risk management strategies in your trading.
Coinbase Institutional Smart Money Detector
◆ 개요
Coinbase Institutional Smart Money Detector는 코인베이스 프라임(Coinbase Prime)을 통한 기관 투자자들의 현물 비트코인 매수/매도 움직임을 실시간으로 감지하는 혁신적인 지표입니다. 이 강력한 도구는 대형 기관들의 자금 흐름을 추적하여 중요한 시장 방향 전환이 일어나기 전에 귀중한 신호를 제공합니다. 어떤 거래소의 비트코인 차트에도 적용 가능하여 트레이더들이 언제 어디서든 기관의 "스마트 머니" 움직임을 따라갈 수 있게 해줍니다.
이 지표의 독보적인 강점은 코인베이스 데이터를 실시간으로 분석하여 기관 투자자들의 연속적인 매매 행동, 거래량 패턴, 그리고 추세 강도를 종합적으로 평가한다는 점입니다. 일반 트레이더들이 접근하기 어려운 기관 자금 흐름 데이터를 시각적으로 명확하게 제공함으로써, 여러분은 시장의 큰 손들과 함께 움직일 수 있는 기회를 얻게 됩니다.
─────────────────────────────────────
◆ 주요 특징
• 코인베이스 프라임 데이터 분석: 기관 전용 서비스인 코인베이스 프라임의 데이터를 실시간으로 추적하여 기관의 움직임 포착
• 실시간 기관 자금 흐름 모니터링: 대형 기관들의 현물 매수/매도 활동을 즉각적으로 감지하여 시장에 앞서 포지셔닝 가능
• 모든 거래소 호환성: 어떤 거래소의 비트코인 차트에도 적용 가능하여 선호하는 트레이딩 플랫폼에서 활용 가능
• 기관 연속성 분석: 연속적인 매수/매도 패턴을 추적하여 기관의 지속적인 활동 식별
• 스마트 볼륨 분석: 평균 대비 거래량 증가를 감지하고 주요 거래 시간대를 분석
• 추세 강도 측정: 캔들 패턴을 분석해 상승/하락 추세의 강도를 수치화하여 표시
• 직관적 시각화: 바 컬러링과 라벨을 통해 기관 활동 지점을 차트에 명확하게 표시
• 실시간 강도 표시: 현재 추세의 강도를 실시간으로 계산하여 테이블에 표시
• 사용자 정의 설정: 주요 매개변수를 조정하여 자신의 트레이딩 스타일에 맞게 커스터마이징 가능
─────────────────────────────────────
◆ 신호 유형 이해하기
■ 기관 매수 신호
• 정의: 코인베이스 프라임을 통해 기관 투자자들이 연속적인 매수 활동을 보이며, 이와 함께 거래량 증가와 강한 상승 추세가 나타날 때 발생
• 시각적 표현: 매수 신호가 발생한 캔들에 반투명 파란색 바 컬러링과 함께 "Institution Buying Detected!" 라벨 표시
• 시장 해석: 기관 투자자들이 적극적으로 현물 비트코인을 매수하고 있으며, 이는 곧 가격 상승으로 이어질 가능성이 높음을 의미
• 신호 강도 요소:
▶ 연속적인 가격 상승 패턴
▶ 평균보다 높은 거래량
▶ 강한 상승 추세 강도 측정값
▶ 유의미한 가격 변동
■ 기관 매도 신호
• 정의: 코인베이스 프라임을 통해 기관 투자자들이 연속적인 매도 활동을 보이며, 이와 함께 거래량 증가와 강한 하락 추세가 나타날 때 발생
• 시각적 표현: 매도 신호가 발생한 캔들에 반투명 분홍색 바 컬러링과 함께 "Institution Selling Detected!" 라벨 표시
• 시장 해석: 기관 투자자들이 적극적으로 현물 비트코인을 매도하고 있으며, 이는 곧 가격 하락으로 이어질 가능성이 높음을 의미
• 신호 강도 요소:
▶ 연속적인 가격 하락 패턴
▶ 평균보다 높은 거래량
▶ 강한 하락 추세 강도 측정값
▶ 유의미한 가격 변동
─────────────────────────────────────
◆ 추세 강도 이해하기
■ 추세 강도 측정 방식
• 정의: 최근 일정 기간 동안의 상승/하락 캔들 비율을 분석하여 추세의 강도를 측정
• 시각적 표현: 테이블에 "BULL STRENGTH" 또는 "BEAR STRENGTH"로 표시되며, 백분율 값과 함께 "STRONG" 또는 "WEAK" 상태 표시
• 강도 임계값: 사용자가 설정 가능한 임계값에 따라 강함/약함 판정
• 계산 방식:
▶ 상승 추세 강도 = (상승 캔들 수) / (전체 분석 기간)
▶ 하락 추세 강도 = (하락 캔들 수) / (전체 분석 기간)
▶ 강도가 임계값 이상일 때 "STRONG", 미만일 때 "WEAK"로 표시
■ 추세 강도의 활용
• 신호 필터링: 추세 강도가 강할 때만 신호를 생성하여 허위 신호 감소
• 추세 확인: 현재 시장 추세의 건전성과 지속 가능성 평가
• 진입/퇴출 결정: 강한 추세에서 진입하고 약한 추세로 전환될 때 퇴출 고려
• 리스크 관리: 약한 추세에서는 포지션 크기를 줄이고, 강한 추세에서는 늘리는 전략 수립 가능
─────────────────────────────────────
◆ 실전 트레이딩 응용
■ 기관 매수 신호 활용 전략
• 추세 전환 시나리오:
▶ 설정: 하락 추세 중 강한 기관 매수 신호 발생
▶ 진입: 신호 확인 후 다음 캔들에서 매수
▶ 손절: 신호 캔들의 저점 아래
▶ 이익실현: 이전 주요 저항선 도달 시 또는 추세 강도가 약해질 때
• 추세 지속 시나리오:
▶ 설정: 상승 추세 중 조정 후 기관 매수 신호 발생
▶ 진입: 신호 확인 후 매수
▶ 손절: 최근 주요 저점 아래
▶ 이익실현: 추세 강도를 고려하여 단계적으로 이익실현
■ 기관 매도 신호 활용 전략
• 추세 전환 시나리오:
▶ 설정: 상승 추세 중 강한 기관 매도 신호 발생
▶ 진입: 신호 확인 후 다음 캔들에서 매도
▶ 손절: 신호 캔들의 고점 위
▶ 이익실현: 이전 주요 지지선 도달 시 또는 추세 강도가 약해질 때
• 추세 지속 시나리오:
▶ 설정: 하락 추세 중 반등 후 기관 매도 신호 발생
▶ 진입: 신호 확인 후 매도
▶ 손절: 최근 주요 고점 위
▶ 이익실현: 추세 강도를 고려하여 단계적으로 이익실현
■ 다중 시간프레임 접근법
• 상위 시간프레임 방향성 확인:
▶ 일봉/4시간봉에서 기관 신호 및 추세 강도 확인
▶ 주 트레이딩 방향 설정에 활용
• 하위 시간프레임 진입점 찾기:
▶ 상위 시간프레임 방향과 일치하는 하위 시간프레임 신호 대기
▶ 정밀한 진입점 포착에 활용
• 시간프레임 간 신호 일치 확인:
▶ 여러 시간프레임에서 동일한 방향의 신호가 발생할 때 신호 강도 증가
▶ 높은 확률의 트레이딩 기회 포착
─────────────────────────────────────
◆ 지표 설정 가이드
■ 주요 설정 매개변수
• Institutional Continuity Period (기관 연속성 확인 기간):
▶ 목적: 기관의 연속적인 매수/매도 활동을 확인할 기간 설정
▶ 낮은 값: 더 많은 신호 생성, 반응성 증가
▶ 높은 값: 신호 수 감소, 신뢰성 증가
• Trend Strength Threshold (추세 강도 임계값):
▶ 목적: 추세가 강하다고 판단할 최소 임계값 설정
▶ 낮은 값: 더 많은 신호, 낮은 필터링
▶ 높은 값: 더 강한 추세에서만 신호 생성, 높은 필터링
─────────────────────────────────────
◆ 다른 지표와의 시너지
• 지지/저항 레벨:
▶ 주요 지지/저항 레벨에서 발생하는 기관 신호는 확률이 더 높음
▶ 기술적 분석의 핵심 레벨과 기관 활동의 결합은 강력한 시그널 제공
• 이동평균선:
▶ 주요 이동평균선(50MA, 200MA) 근처에서 발생하는 기관 신호 주목
▶ 이동평균선 돌파와 기관 신호가 일치할 때 강한 추세 변화 가능성
• RSI/모멘텀 지표:
▶ 과매수/과매도 상태에서 발생하는 기관 신호는 반전 가능성 높임
▶ 모멘텀 다이버전스와 기관 신호의 일치는 강력한 반전 신호
• 볼륨 프로파일:
▶ 높은 볼륨 노드에서 발생하는 기관 신호는 중요한 가격 레벨 확인
▶ 주요 거래 영역에서의 기관 활동은 가격 방향에 큰 영향 미침
• 시장 구조:
▶ 주요 시장 구조(높은 고점/저점, 낮은 고점/저점) 근처에서 발생하는 기관 신호는 구조 변화 암시
▶ 시장 구조 변화와 기관 활동의 일치는 중요한 추세 전환점 표시
─────────────────────────────────────
◆ 결론
Coinbase Institutional Smart Money Detector는 코인베이스 프라임을 통한 기관 투자자들의 현물 비트코인 거래 활동을 실시간으로 추적하여 트레이더들에게 귀중한 통찰력을 제공합니다. 어떤 거래소의 비트코인 차트에도 적용 가능하기 때문에, 여러분이 선호하는 트레이딩 플랫폼에서 바로 활용할 수 있습니다.
이 지표의 핵심 가치는 일반 트레이더들이 접근하기 어려운 기관 자금 흐름 데이터를 직관적으로 시각화하여 제공한다는 점입니다. 연속적인 가격 움직임, 거래량 증가, 그리고 추세 강도를 종합적으로 분석하여 기관의 활동을 포착함으로써, 여러분은 시장의 큰 손들과 함께 움직일 수 있는 기회를 얻게 됩니다.
코인베이스 프라임 데이터를 기반으로 한 명확한 매수/매도 신호와 실시간 추세 강도 측정은 트레이더들이 시장 상황을 한눈에 파악하고 신속하게 전략적 결정을 내릴 수 있게 도와줍니다. 이 강력한 도구를 여러분의 트레이딩 전략에 통합함으로써, 시장의 스마트 머니가 어디로 흘러가는지 파악하고 그에 따라 포지셔닝할 수 있는 경쟁 우위를 확보하세요.
─────────────────────────────────────
※ 면책 조항: 모든 트레이딩 도구와 마찬가지로, Institutional Smart Money Detector는 보조 지표로 사용해야 하며 트레이딩 결정을 전적으로 의존해서는 안 됩니다. 과거의 기관 행동 패턴이 미래 시장 움직임을 보장하지는 않습니다. 항상 적절한 리스크 관리 전략을 트레이딩에 활용하세요.

Automated Scalping Signals with TP/SL Indicator [QuantAlgo]🟢 Overview
The Automated Scalping Signals with Take Profit & Stop Loss Indicator is a multi-timeframe trading system that combines market structure analysis with directional bias filtering to identify potential scalping opportunities. It detects Points of Interest (POI) including Fair Value Gaps (FVG) and Order Blocks (OB) while cross-referencing entries with higher timeframe exponential moving average positioning to create systematic entry conditions.
The indicator features adaptive timeframe calculations that automatically scale analysis periods based on your chart timeframe, maintaining consistent analytical relationships across different trading sessions. It provides integrated trade management with stop loss calculation methods, configurable risk-reward ratios, and real-time performance tracking through dashboard displays showing trade statistics, bias direction, and active position status.
This advanced system is designed for low timeframe trading, typically performing optimally on 1 to 15-minute charts across popular instruments such as OANDA:XAUUSD , CME_MINI:MES1! , CME_MINI:ES1! , CME_MINI:MNQ1! , CBOT_MINI:YM1! , CBOT_MINI:MYM1! , BYBIT:BTCUSDT.P , BYBIT:ETHUSDT.P , or any asset and timeframe of your preference.
🟢 How It Works
The indicator operates using a dual-timeframe mathematical framework where higher timeframe exponential moving averages establish directional bias through cross-over analysis, while simultaneously scanning for specific market structure patterns on the POI timeframe. The timeframe calculation engine uses multiplication factors to determine analysis periods, ensuring the bias timeframe provides trend context while the POI timeframe captures structural formations.
The structural analysis begins with FVG detection, which systematically scans price action to identify imbalances where gaps exist between consecutive candle ranges with no overlapping wicks. When such gaps are detected, the algorithm measures their size against minimum thresholds to filter out insignificant formations. Concurrently, OB recognition analyzes three-candle sequences, examining specific open/close relationships that indicate potential institutional accumulation zones. Once these structural patterns are identified, the algorithm cross-references them against the higher timeframe bias direction, creating a validation filter that only permits entries aligned with the prevailing EMA cross-over state. When price subsequently intersects these validated POI zones, entry signals generate with the system calculating entry levels at zone midpoints, then applying the selected stop loss methodology combined with the configured risk-reward ratio to determine take profit placement.
To mirror realistic trading conditions, the indicator incorporates configurable slippage calculations that account for execution differences between intended and actual fill prices. When trades reach their take profit or stop loss levels, the algorithm applies slippage adjustments that worsen the exit prices in a conservative manner - reducing take profit fills and increasing stop loss impact. This approach ensures backtesting results reflect more realistic performance expectations by accounting for spread costs, market volatility during execution, and liquidity constraints that occur in live trading environments.
It also has a performance dashboard that continuously tracks and displays comprehensive trading metrics:
1/ Bias TF / POI TF: Displays the calculated timeframes used for bias analysis and POI detection, showing the actual periods (e.g., "15m / 5m") that result from the multiplier settings to confirm proper adaptive timeframe selection
2/ Bias Direction: Shows current market trend assessment (Bullish, Bearish, or Sideways) derived from EMA cross-over analysis to indicate which trade directions align with prevailing momentum
3/ Data Processing: Indicates how many price bars have been analyzed by the system, helping users verify if complete historical data has been processed for comprehensive strategy validation
4/ Total Trades: Displays the cumulative number of completed trades plus any active positions, providing volume assessment for statistical significance of other metrics
5/ Wins/Losses: Shows the raw count of profitable versus unprofitable trades, offering immediate insight into strategy effectiveness frequency
6/ Win Rate: Reveals the percentage of successful trades, where values above 50% generally indicate effective entry timing and values below suggest strategy refinement needs
7/ Total R-Multiple: Displays cumulative risk-reward performance across all trades, with positive values demonstrating profitable system operation and negative values indicating net losses requiring analysis
8/ Average R Win/Loss: Shows average risk-reward ratios for winning and losing trades separately, where winning averages approaching the configured take profit ratio indicate minimal slippage impact while losing averages near -1.0 suggest effective stop loss execution
9/ TP Ratio / Slippage: Displays the configured take profit ratio and slippage settings with calculated performance impact, showing how execution costs affect actual versus theoretical returns
10/ Profit Factor: Calculates the ratio of total winning amounts to total losing amounts, where values above 1.5 suggest robust profitability, values between 1.0-1.5 indicate modest success, and values below 1.0 show net losses
11/ Maximum Drawdown: Tracks the largest peak-to-trough decline in R-multiple terms, with smaller negative values indicating better capital preservation and risk control during losing streaks
🟢 How to Use
Start by applying the indicator to your chart and observe its performance across different market conditions to understand how it identifies bias direction and POI formations. Then navigate to the settings panel to configure the Bias Timeframe Multiplier for trend context sensitivity and POI Timeframe Multiplier for structural analysis frequency according to your trading preference and objectives.
Next, fine-tune the EMA periods in Bias Settings to control trend detection sensitivity and select your preferred POI types based on your analytical preference. Proceed to configure your Risk Management approach by selecting from the available stop loss calculation methods and setting the Take Profit ratio that aligns with your risk tolerance and profit objectives. Complete the setup by customizing Display Settings to control table visibility and trade visualization elements, adjusting UI positioning and colors for optimal chart readability, then activate Alert Conditions for automated notifications on trade entries, exits, and bias direction changes to support systematic trade management.
🟢 Examples
OANDA:XAUUSD
CME_MINI:MES1!
CME_MINI:ES1!
CME_MINI:MNQ1!
CBOT_MINI:YM1!
BYBIT:BTCUSDT.P
BINANCE:SOLUSD
*Disclaimer: Past performance is not indicative of future results. None of our statements, claims, or signals from our indicators are intended to be financial advice. All trading involves substantial risk of loss, not just upside potential. Users are highly recommended to carefully consider their financial situation and risk tolerance before trading.

LotSize CalculatorLotSize Calculator Documentation
Overview
The LotSize Calculator is a powerful TradingView indicator designed to help traders calculate optimal position sizes based on risk management principles. It provides a visual representation of trade setups, including entry points, stop losses, and take profits, while calculating the appropriate lot size based on your risk preferences.
Key Features
Automatic lot size calculation based on risk amount
Support for multiple asset classes (forex, commodities, indices, etc.)
Visual R-multiple levels (1R to 5R)
Real-time position tracking with drawdown and run-up statistics
Customizable visual elements and display options
Input Parameters
Risk Management Settings
Risk Amount Type: Choose between risking a fixed amount in dollars ($) or a specific lot size.
Risk Amount: The amount you want to risk on the trade (in dollars if Risk Amount Type is set to $, or in lots if set to Lots).
Overwrite TP: Optional setting to automatically set take profit at a specific R-multiple (1R, 2R, 3R, 4R, or 5R).
Table Comments: Optional field to add personal notes to the position table.
Trade Setup Levels
Trigger Price: The price at which your trade will be entered.
Stop Loss: Your predetermined exit price to limit losses.
Take Profit: Your target price to secure profits.
Time Of Setup Start Bar: The starting time for your trade setup window.
Display Settings
Plot Position Labels: Toggle to show/hide position information labels on the chart.
Plot Position Table: Toggle to show/hide the position information table.
Show Money: Toggle to display monetary values ($) in the labels and table.
Show Points: Toggle to display point values in the labels and table.
Show Ticks: Toggle to display tick values in the labels and table.
Visual Appearance
Entry Color: Color for entry level line and labels.
Take Profit Color: Color for take profit level line and labels.
Stop Loss Color: Color for stop loss level line and labels.
Label Text Color: Color for text in the position labels.
Table Background: Background color for the position information table.
Table Text: Text color for the position information table.
R Labels: Color for the R-multiple level labels.
Table Position: Position of the information table on the chart (options: Bottom Right, Bottom Left, Bottom Middle, Top Right, Top Middle).
How to Use
Basic Setup
Set your entry price in the "Trigger Price" field.
Set your stop loss level in the "Stop Loss" field.
Set your take profit level in the "Take Profit" field.
Choose your risk amount type ($ or Lots) and enter the risk amount.
Optionally, select an R-multiple for automatic take profit calculation.
Understanding the Display
The indicator will show:
Horizontal lines for entry, stop loss, and take profit levels
Colored zones between entry and take profit (potential profit zone) and between entry and stop loss (potential loss zone)
R-multiple levels based on your risk (1R, 2R, 3R, 4R, 5R)
A table displaying:
Position type (long/short) and size
Original risk and reward figures
Maximum run-up and drawdown during the trade
Trade Monitoring
Once a trade is triggered (either by price crossing a stop entry or reaching a limit entry), the indicator tracks:
Current position value
Maximum run-up (highest profit seen)
Maximum drawdown (largest loss seen)
Trade outcome when take profit or stop loss is hit
Advanced Features
Asset Type Detection
The LotSize Calculator automatically detects the type of asset being traded (forex, commodity, index, etc.) and adjusts calculations accordingly to ensure accurate position sizing.
R-Multiple Visualization
R-multiples help visualize potential reward relative to risk. For example, 2R means the potential reward is twice the amount risked. The indicator displays these levels directly on your chart for easy reference.
Adaptive Position Labels
Position labels adjust their display based on trade direction (long or short) and include relevant information about risk, reward, and current position status.
Best Practices
Always confirm your risk is appropriate for your account size (typically 1-2% of account per trade).
Use the R-multiple visualization to ensure your trades offer favorable risk-to-reward ratios.
The indicator works best when used alongside your existing strategy for entry and exit signals.
Customize the visual appearance to match your chart theme for better visibility.
Troubleshooting
If position calculations seem incorrect, verify that the indicator is detecting the correct instrument type.
For forex pairs, ensure your broker's lot size conventions match those used by the indicator.
The indicator may need adjustment for certain exotic instruments or markets with unusual tick sizes.
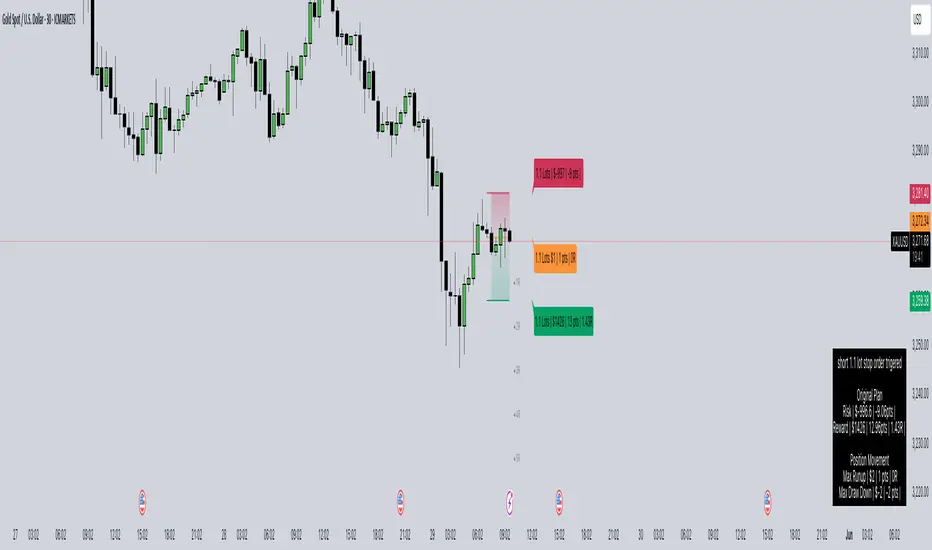
Stochastic RSI with MTF TableShort Description of the Script
The provided Pine Script indicator, titled "Stochastic RSI with MTF Table," calculates and displays the Stochastic RSI for the current timeframe and multiple other timeframes (5m, 15m, 30m, 60m, 240m, and daily). The Stochastic RSI is a momentum indicator that blends the Relative Strength Index (RSI) and Stochastic Oscillator to identify overbought and oversold conditions, as well as potential trend reversals via K and D line crossovers.
Key features of the script include:
Inputs: Customizable parameters such as K smoothing (default 3), D smoothing (default 3), RSI length (default 14), Stochastic length (default 14), source price (default close), and overbought/oversold levels (default 80/20).
MTF Table: A table displays the Stochastic RSI status for each timeframe:
"OB" (overbought) if K > 80, "OS" (oversold) if K < 20, or "N" (neutral) otherwise.
Crossovers: "K↑D" for bullish (K crosses above D) and "K↓D" for bearish (K crosses below D).
Visualization: Plots the K and D lines for the current timeframe, with horizontal lines at 80 (overbought), 50 (middle), and 20 (oversold), plus a background fill for clarity.
Table Position: Configurable to appear in one of four chart corners (default: top-right).
This indicator helps traders assess momentum across multiple timeframes simultaneously, aiding in the identification of trend strength and potential entry/exit points.
Trading Strategy with 50EMA and 200EMA for Highest Winning Rate
To create a strategy with the best probability of a high winning rate using the Stochastic RSI MTF indicator alongside the 50-period Exponential Moving Average (50EMA) and 200-period Exponential Moving Average (200EMA), we can combine trend identification with momentum-based entry timing. The 50EMA and 200EMA are widely used to determine medium- and long-term trends, while the Stochastic RSI MTF table provides multi-timeframe momentum signals. Here’s the strategy:
1. Determine the Overall Trend
Bullish Trend: The 50EMA is above the 200EMA on the current timeframe (e.g., daily or 60m chart). This suggests an uptrend, often associated with a "Golden Cross."
Bearish Trend: The 50EMA is below the 200EMA on the current timeframe. This indicates a downtrend, often linked to a "Death Cross."
Implementation: Plot the 50EMA and 200EMA on your chart and visually confirm their relative positions.
2. Identify Entry Signals Using the Stochastic RSI MTF Table
In a Bullish Trend (50EMA > 200EMA):
Look for timeframes in the MTF table showing:
Oversold (OS): K < 20, indicating a potential pullback in the uptrend where price may rebound.
Bullish Crossover (K↑D): K crosses above D, signaling rising momentum and a potential entry point.
Example: If the 60m and 240m timeframes show "OS" or "K↑D," this could be a buy signal.
In a Bearish Trend (50EMA < 200EMA):
Look for timeframes in the MTF table showing:
Overbought (OB): K > 80, suggesting a rally in the downtrend where price may reverse downward.
Bearish Crossover (K↓D): K crosses below D, indicating declining momentum and a potential short entry.
Example: If the 30m and daily timeframes show "OB" or "K↓D," this could be a sell/short signal.
Current Timeframe Check: Use the plotted K and D lines on your trading timeframe for precise entry timing (e.g., confirm a K↑D crossover on a 60m chart for a long trade).
3. Confirm Signals Across Multiple Timeframes
Strengthen the Signal: A higher winning rate is more likely when multiple timeframes align with the trend and signal. For instance:
Bullish trend + "OS" or "K↑D" on 60m, 240m, and daily = strong buy signal.
Bearish trend + "OB" or "K↓D" on 15m, 60m, and 240m = strong sell signal.
Prioritize Higher Timeframes: Signals from the 240m or daily timeframe carry more weight due to their indication of broader trends, increasing reliability.
4. Set Stop-Loss and Take-Profit Levels
Long Trades (Bullish):
Stop-Loss: Place below the most recent swing low or below the 50EMA, whichever is closer, to protect against trend reversals.
Take-Profit: Target a key resistance level or use a risk-reward ratio (e.g., 2:1 or 3:1) based on the stop-loss distance.
Short Trades (Bearish):
Stop-Loss: Place above the most recent swing high or above the 50EMA, whichever is closer.
Take-Profit: Target a key support level or apply a similar risk-reward ratio.
Trailing Stop Option: As the trend progresses, trail the stop below the 50EMA (for longs) or above it (for shorts) to lock in profits.
5. Risk Management
Position Sizing: Risk no more than 1-2% of your trading capital per trade to minimize losses from false signals.
Volatility Consideration: Adjust stop-loss distances and position sizes based on the asset’s volatility (e.g., wider stops for volatile stocks or crypto).
Avoid Overtrading: Wait for clear alignment between the EMA trend and MTF signals to avoid low-probability setups.
Example Scenario
Chart: 60-minute timeframe.
Trend: 50EMA > 200EMA (bullish).
MTF Table: 60m shows "OS," 240m shows "K↑D," and daily is "N."
Action: Enter a long position when the 60m K line crosses above D, confirming the table signal.
Stop-Loss: Below the recent 60m swing low (e.g., 2% below entry).
Take-Profit: At the next resistance level or a 3:1 reward-to-risk ratio.
Outcome: High probability of success due to trend alignment and multi-timeframe confirmation.
Why This Strategy Works
Trend Following: Trading in the direction of the 50EMA/200EMA trend reduces the risk of fighting the market’s momentum.
Momentum Timing: The Stochastic RSI MTF table pinpoints pullbacks or reversals within the trend, improving entry timing.
Multi-Timeframe Confirmation: Alignment across timeframes filters out noise, increasing the win rate.
Risk Control: Defined stop-loss and position sizing protect against inevitable losses.
Caveats
No strategy guarantees a 100% win rate; false signals can occur, especially in choppy markets.
Test this strategy on historical data or a demo account to verify its effectiveness for your asset and timeframe.
This approach leverages the strengths of both trend-following (EMA) and momentum (Stochastic RSI) tools, aiming for a high-probability, disciplined trading system.

Momentum Volume Divergence (MVD) EnhancedMomentum Volume Divergence (MVD) Enhanced is a powerful indicator that detects price-momentum divergences and momentum suppression for reversal trading. Optimized for XRP on 1D charts, it features dynamic lookbacks, ATR-adjusted thresholds, and SMA confirmation. Signals include strong divergences (triangles) and suppression warnings (crosses). Includes a detailed user guide—try it out and share your feedback!
Setup: Add to XRP 1D chart with defaults (mom_length_base=8, vol_length_base=10). Signals: Red triangle (sell), Green triangle (buy), Orange cross (bear warning), Yellow cross (bull warning). Confirm with 5-day SMA crossovers. See full guide for details!
Disclaimer: This indicator is for educational purposes only, not financial advice. Trading involves risk—use at your discretion.
Momentum Volume Divergence (MVD) Enhanced Indicator User Guide
Version: Pine Script v6
Designed for: TradingView
Recommended Use: XRP on 1-day (1D) chart
Date: March 18, 2025
Author: Herschel with assistance from Grok 3 (xAI)
Overview
The Momentum Volume Divergence (MVD) Enhanced indicator is a powerful tool for identifying price-momentum divergences and momentum suppression patterns on XRP’s 1-day (1D) chart. Plotted below the price chart, it provides clear visual signals to help traders spot potential reversals and trend shifts.
Purpose
Detect divergences between price and momentum for buy/sell opportunities.
Highlight momentum suppression as warnings of fading trends.
Offer actionable trading signals with intuitive markers.
Indicator Components
Main Plot
Volume-Weighted Momentum (vw_mom): Blue line showing momentum adjusted by volume.
Above 0 = bullish momentum.
Below 0 = bearish momentum.
Zero Line: Gray dashed line at 0, separating bullish/bearish zones.
Key Signals
Strong Bearish Divergence:
Marker: Red triangle at the top.
Meaning: Price makes a higher high, but momentum weakens, confirmed by a drop below the 5-day SMA.
Action: Potential sell/short signal.
Strong Bullish Divergence:
Marker: Green triangle at the bottom.
Meaning: Price makes a lower low, but momentum strengthens, confirmed by a rise above the 5-day SMA.
Action: Potential buy/long signal.
Bearish Suppression:
Marker: Orange cross at the top + red background.
Meaning: Strong bullish momentum with low volume in a volume downtrend, suggesting fading strength.
Action: Warning to avoid longs or exit early.
Bullish Suppression:
Marker: Yellow cross at the bottom + green background.
Meaning: Strong bearish momentum with low volume in a volume uptrend, suggesting fading weakness.
Action: Warning to avoid shorts or exit early.
Debug Plots (Optional)
Volume Ratio: Gray line (volume vs. its MA) vs. yellow line (threshold).
Momentum Threshold: Purple lines (positive/negative momentum cutoffs).
Smoothed Momentum: Orange line (raw momentum).
Confirmation SMA: Purple line (price trend confirmation).
Labels
Text labels (e.g., "Bear Div," "Bull Supp") mark detected patterns.
How to Use the Indicator
Step-by-Step Trading Process
1. Monitor the Chart
Load your XRP 1D chart with the indicator applied.
Observe the blue vw_mom line and signal markers.
2. Spot a Signal
Primary Signals: Look for red triangles (strong_bear) or green triangles (strong_bull).
Warnings: Note orange crosses (suppression_bear) or yellow crosses (suppression_bull).
3. Confirm the Signal
For Strong Bullish Divergence (Buy):
Green triangle appears.
Price closes above the 5-day SMA (purple line) and a recent swing high.
Optional: Volume ratio (gray line) exceeds the threshold (yellow line).
For Strong Bearish Divergence (Sell):
Red triangle appears.
Price closes below the 5-day SMA and a recent swing low.
Optional: Volume ratio (gray line) falls below the threshold (yellow line).
4. Enter the Trade
Long:
Buy at the close of the signal bar.
Stop loss: Below the recent swing low or 2 × ATR(14) below entry.
Short:
Sell/short at the close of the signal bar.
Stop loss: Above the recent swing high or 2 × ATR(14) above entry.
5. Manage the Trade
Take Profit:
Aim for a 2:1 or 3:1 risk-reward ratio (e.g., risk $0.05, target $0.10-$0.15).
Or exit when an opposite suppression signal appears (e.g., orange cross for longs).
Trailing Stop:
Move stop to breakeven after a 1:1 RR move.
Trail using the 5-day SMA or 2 × ATR(14).
Early Exit:
Exit if a suppression signal appears against your position (e.g., suppression_bull while short).
6. Filter Out Noise
Avoid trades if a suppression signal precedes a divergence within 2-3 days.
Optional: Add a 50-day SMA on the price chart:
Longs only if price > 50-SMA.
Shorts only if price < 50-SMA.
Example Trades (XRP 1D)
Bullish Trade
Signal: Green triangle (strong_bull) at $0.55.
Confirmation: Price closes above 5-SMA and $0.57 high.
Entry: Buy at $0.58.
Stop Loss: $0.53 (recent low).
Take Profit: $0.63 (2:1 RR) or exit on suppression_bear.
Outcome: Price hits $0.64, exit at $0.63 for profit.
Bearish Trade
Signal: Red triangle (strong_bear) at $0.70.
Confirmation: Price closes below 5-SMA and $0.68 low.
Entry: Short at $0.67.
Stop Loss: $0.71 (recent high).
Take Profit: $0.62 (2:1 RR) or exit on suppression_bull.
Outcome: Price drops to $0.61, exit at $0.62 for profit.
Tips for Success
Combine with Price Levels:
Use support/resistance zones (e.g., weekly pivots) to confirm entries.
Monitor Volume:
Rising volume (gray line above yellow) strengthens signals.
Adjust Sensitivity:
Too many signals? Increase div_strength_threshold to 0.7.
Too few signals? Decrease to 0.3.
Backtest:
Review 20-30 past signals on XRP 1D to assess performance.
Avoid Choppy Markets:
Skip signals during low volatility (tight price ranges).
Troubleshooting
No Signals:
Lower div_strength_threshold to 0.3 or mom_threshold_base to 0.2.
Check if XRP’s volatility is unusually low.
False Signals:
Increase sma_confirm_length to 7 or add a 50-SMA filter.
Indicator Not Loading:
Ensure the script compiles without errors.
Customization (Optional)
Change Colors: Edit color.* values (e.g., color.red to color.purple).
Add Alerts: Use TradingView’s alert menu for "Strong Bearish Divergence Confirmed," etc.
Test Other Assets: Experiment with BTC or ETH, adjusting inputs as needed.
Disclaimer
This indicator is for educational purposes only and not financial advice. Trading involves risk, and past performance does not guarantee future results. Use at your own discretion.
Setup: Use on XRP 1D with defaults (mom_length_base=8, vol_length_base=10). Signals: Red triangle (sell), Green triangle (buy), Orange cross (bear warning), Yellow cross (bull warning). Confirm with 5-day SMA cross. Stop: 2x ATR(14). Profit: 2:1 RR or suppression exit. Full guide available separately!
